| Population by Age and Area | ||||
|---|---|---|---|---|
| Area | 0 - 15 years | 16 - 64 years | 65+ years | Total |
| Derby | 54,956 | 174,676 | 44,517 | 274,149 |
| Derbyshire | 137,322 | 499,035 | 186,020 | 822,377 |
| Amber Valley | 21,569 | 78,858 | 30,024 | 130,451 |
| Bolsover | 14,300 | 52,218 | 17,255 | 83,773 |
| Chesterfield | 17,604 | 64,755 | 23,686 | 106,045 |
| Derbyshire Dales | 10,111 | 40,615 | 21,031 | 71,757 |
| Erewash | 19,174 | 70,825 | 24,254 | 114,253 |
| High Peak | 14,973 | 55,690 | 21,296 | 91,959 |
| North East Derbyshire | 17,684 | 62,527 | 26,435 | 106,646 |
| South Derbyshire | 21,907 | 73,547 | 22,039 | 117,493 |
| Source: Mid-year estimates 2024 | ||||
Bolsover
Locality
Bolsover
Diabetes
Dementia
Smoking
Ageing Population
Demographics

 Introduction
With a population of around 80,000 (Census 2021), Bolsover District covers an area of 160.3 square kilometres and sits in the north east area of Derbyshire. The District adjoins North East Derbyshire and Chesterfield to the west, and the north east section of Amber Valley Borough to the south. The District shares boundary with Nottinghamshire County Council and the districts of Bassetlaw, Mansfield and Ashfield to the south.
The District comprises of two small towns (Bolsover and Shirebrook), two emerging towns (South Normanton and Clowne) and villages of varying sizes. Just over half of the population of the district (around 53%) live in these four main settlements. The rest of the District is predominantly rural with smaller settlements in the countryside.
- Bolsover (Bramley Vale, Doe Lea, Scarcliffe, Stanfree, Palterton, Glapwell)
- Clowne (Barlborough, Creswell, Whitwell, Hodthorpe, Elmton)
- Shirebrook (Pleasley, Pleasley Vale, Langwith, Whaley Thorns, New Houghton)
- South Normanton (Pinxton, Blackwell, Hilcote, Newton, Tibshelf, Westhouses)
The District has an industrial heritage and was a major producer of coal. Mining was the main industry in the region for many decades, until its decline, with the final collieries closing in the early 1990’s. The mining industry has been largely replaced by low skilled, low paid employment opportunities.
There are three Primary Care Networks; North Hardwick and Bolsover, North East Derbyshire (covering Clowne and Barlborough) and South Hardwick (covering South Normanton and Pixton). With no acute care or general hospital and no sixth form or further education, residents travel to areas of Derbyshire and Nottinghamshire. (Residents in the north generally access hospital services in Chesterfield, Bassetlaw, Nottinghamshire and in the south across Nottinghamshire and Amber Valley).
Bolsover District has some of the most challenging health indicators across Derbyshire County. It is the most deprived District and has the lowest life expectancies for males and females in Derbyshire.
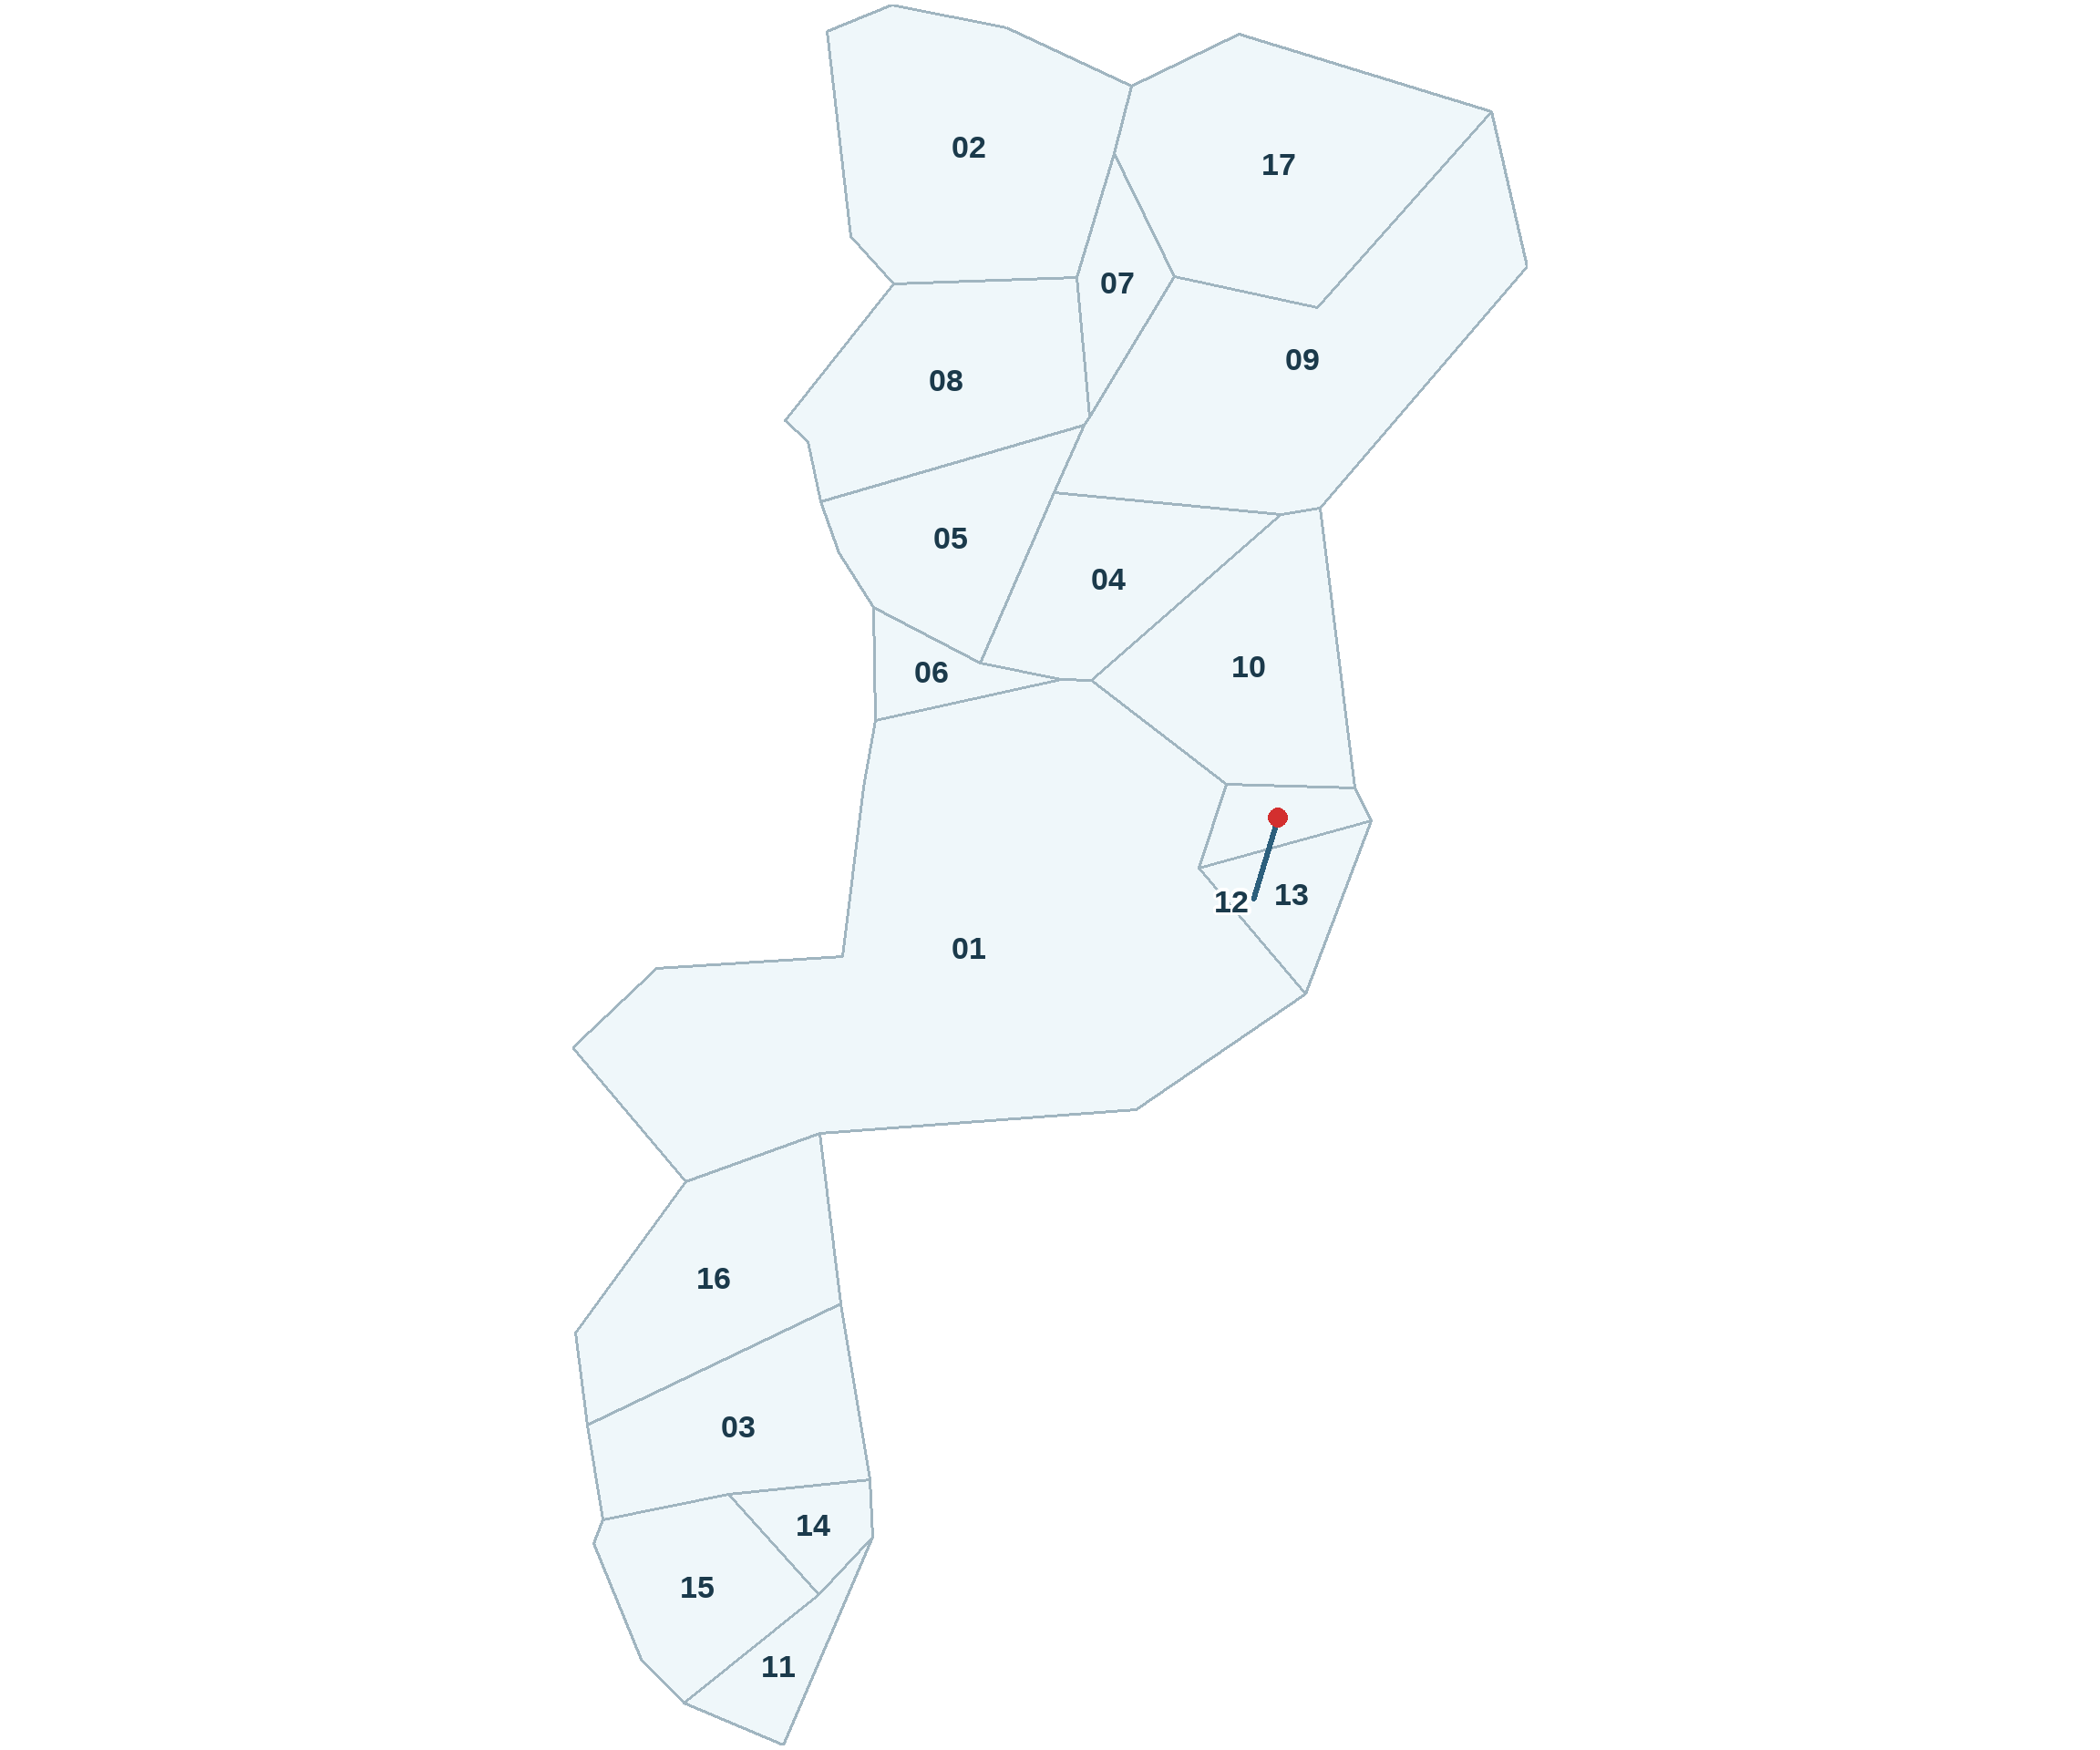
WARD REFERENCE
01: Ault Hucknall
02: Barlborough
03: Blackwell
04: Bolsover East
05: Bolsover North & Shuttlewood
06: Bolsover South
07: Clowne East
08: Clowne West
09: Elmton-with-Creswell
10: Langwith
11: Pinxton
12: Shirebrook North
13: Shirebrook South
14: South Normanton East
15: South Normanton West
16: Tibshelf
17: Whitwell
 Why is it important to Population Health?
Health inequalities are defined as avoidable differences in health outcomes between groups or populations – such as differences in how long we live, or the age at which we get preventable diseases or health conditions. These are often linked to social, economic and environmental factors. Bolsover District has higher levels of poverty compared with the rest of Derbyshire, meaning a greater proportion of residents struggle financially. When we don’t have the things we need like access to healthy food, warm homes or amenities that are easily accessibile and affordable, the constant stress puts strain on our bodies which results in health issues and a weaker immune system. This leads to people dying earlier than they should.
The District has a generally older population. The 2021 Census estimates that 20% of the population are aged 65 and over and this is estimated to increase to 24% by 2033. The percentage of retired households is also higher than the region and England as a whole.
According to the 2021 census, Bolsover has lower levels of unemployment (than East Midlands and England) but has higher levels of the population not working due to long term sickness or disabled.
In Bolsover 18.51% of households have no access to a car or van. This is a greater proportion than in Derbyshire (17.16%) or England (23.54%). Affordability and accessibility of public transport across the area means many residents struggle to access or cannot afford to access support and services.
Public Health priority areas in Bolsover are:
- Life expectancy at birth
- Life expectancy at 65
- Children in absolute low-income families
- Children in relative low-income families
- Pupil absence
- Childhood obesity
- Adult obesity
- Proportion of the population meeting the recommended ‘5 a day’ on a usual day (adults) (old method)
- Low levels of physical activity (NBIC) in adults
- Drug-related deaths
- Alcohol-related hospital admissions
- Prevalence of MSK problems
- Chlamydia detection rate (Females, 14-25)
- Under 75 mortality rate – from causes considered preventable
- Under 75 mortality rate – from cardiovascular disease
- Under 75 mortality rate – from cancer
- Under 75 mortality rate – from cancer considered preventable
- Under 75 mortality rate – from liver disease
- Under 75 mortality rate – from liver disease considered preventable
- Under 75 mortality rate – from respiratory disease
- Under 75 mortality rate – from respiratory disease considered preventable
- Emergency readmission within 30 days of hospital discharge
Addressing these areas at a locality level allows partners to target resources and maximise reach to the populations with the greatest need.
 The Derbyshire Population Health Approach
The Derbyshire Population Health Approach focuses on prevention, population health, evidence-informed practices, causes, and collaboration. It emphasises proactive measures to prevent health issues, tailors interventions to specific populations, incorporates evidence-informed practices, addresses underlying causes, and promotes collaboration for effective action.
When considering Bolsover within The Derbyshire Population Health Approach:
• Prevention
Enable Good Mental Health: Bolsover Health and Wellbeing Partnership is focused on Children and Young People’s mental health; commissioning Thrive to offer children and young people’s social prescribing services across the District. This acts as an early intervention programme supporting children to make positive changes in their lives. The health and wellbeing action group also supports community groups to reduce the mental health impacts of social isolation and shares training and mental health support resources across its members encouraging uptake. The Bolsover locality team have recently been supported by the mental health and suicide prevention team and Bolsover District Council to create a mental health support leaflet for Polish and Romanian communities in Shirebrook.
Fixing the Digital Divide: The Digital Connect programme offers advice, training and support to people who are digitally excluded, equipping people with the skills and confidence to effectively use IT. It has been delivered across the District on both a group and 1:1 basis. Anecdotally there are a significant number of older residents who don’t want to use the internet. Programmes like digital connect need to work with this group to avoid further digital exclusion as more services (such as the NHS, and the removal of analogue telephones) go digital.
Creating Generational Change (a pilot): Through Walk Derbyshire’s Active Neighborhoods Pilot, Bolsover Compass has been working across Shirebrook to get children and young people active. Partners have come together to offer services through trusted community facilities, resulting in good uptake and engagement levels. We now have a model that can be replicated across other areas of the District to support generational change.
Improving Access to Green Spaces: A great asset across the District and often mentioned by residents is the access to their beautiful countryside. Over the past 30 years the old colliery sites have been re-natured to create family friendly country parks and one of the best trails networks in the country. The Bolsover Health and Wellbeing Partnership recognises the importance of the local environment in improving health and wellbeing and projects like Bolsover Compass are integral to breaking down the barriers to accessing it.
• Population
Bolsover District has two neighbourhoods that fall within the 10% most deprived areas in England. These are Carr Vale and Shirebrook. It also has 11 neighbourhoods within the 20% most deprived areas in England (IMD 2019). According to the Income Deprivation Affecting Children Index (2019), 20.45% of children in Bolsover District are income deprived. This is higher than the proportion in East Midlands (16.69%) and higher than the proportion in England (17.08%). The Financial Inclusion Group exists for partners across Bolsover (NE and Chesterfield) who work across the financial inclusion agenda to help increase financial resilience for the most vulnerable. Members include Citizens Advice, credit union, Department Work & Pensions, Foodbanks etc. Partners exchange information and share solutions, shaping the networks actions through their community insight.
There is a shortage of community and voluntary services across the area, however there are key organisations providing excellent provision where residents meet up for companionship and support. Community is incredibility important across the District. Older adults look after their neighbours, help with their shopping and accompany friends to hospital appointments. Through the social connect project BCVS (Bolsover Voluntary and Community Service) works with organisations to support their long-term sustainability and establish new groups around the needs of the community.
There is also some excellent provision for children and young people across the District but access can be difficult due to lack of public transport and associated costs. More varied provision is needed across a wider area. The new Childrens and Young People’s resilience group (a subgroup of the health and wellbeing group) is working with providers and services across the area to help improve overall provision for young people.
• Evidence
Engaging with residents through a trusted voices model (working with community organisations) has proved successful getting evidence for public health initiatives (low vaccine takeup and barriers to walking) along with insight around health, community and social provision. This approach was initially trialed as it was felt traditional ways of engagement had been exhausted and residents were put off by standardised surveys and group conversation.
Community insight such as trusted voices, and data from the JSNA is used by partners to help shape future spend and projects commissioned. Pieces of work such as Trusted Voices have the added value of upskilling locality workers to enable them to better understand public health messaging and target it to the right places.
• Causes
Understanding and addressing health inequalities are important to ensuring that population health approaches can manage and support people to live healthier lives. There are many causes that contribute to poor health outcomes and having a greater understanding of these will help to address them.
Poverty: Poverty has a significant negative impact on healthy life expectancy, with those in the most deprived areas experiencing shorter lives and a greater proportion of their lives spent in poor health. Bolsover is the most deprived District in Derbyshire with two neighbourhoods (Shirebrook and Carr Vale in the 10% most deprived nationally).
Physical Wellbeing: Bolsover District is the 4th least physically active area in England. (Sport England 2019) with Shirebrook having a ratio of 1 in 4 people doing less than 10 minutes walking per day. There is also a high prevalence of obesity in both adults and children and high levels of associated disease and illness. The PALS (Physical Activity and Lifestyle Support) programme helps people to be more physically activity by helping address the barriers that prevent them doing this, for example, travel, cost, confidence etc. This programme has reported 90% of individuals reporting increased activity after 12 weeks.
Environmental Wellbeing: Public transport is infrequent, unreliable or with limited routes. Older residents speak of problems getting to hospital appointments due to the lack of direct buses. For a Shirebrook resident travelling to Barlborough Hospital it takes 1hr 45 minutes on two buses or they have the cost of a taxi. They then wait either before or after appointments due to infrequent services. The train is a great asset for residents traveling from Creswell and Shirebrook to Worksop and Mansfield with hourly trains. However, for those in the villages of Langwith and Whitwell (on the same route) trains only stop every 2 hours. Cost can also be a barrier.
Social Wellbeing: With high levels of deprivation and an aging population, social isolation continues to be a locality priority. Bolsover District has one of the lowest rates of registered voluntary community sector organisations and volunteer engagement in England, with many residents isolated due to poor infrastructure and limited local services (Community Needs Index). Improvements are needed in the voluntary, community and social enterprise infrastructure to help reduce social isolation and help public health services reach residents. Social Prescribing efforts often struggle due to a shortage of accessible activities and services in rural areas.
Digital Inclusion: Bolsover District has a higher level of digital exclusion risk than East Midlands and England (Digital, Exclusion Risk Index (DERI) score 3.47 compared to East Midlands 3.06 England 3.00). This can be attributed to the high levels of deprivation and aging population.
• Collaboration
Working at a locality level the aim is to address health inequalities and promote equitable outcomes for the Bolsover District population by working in partnership with stakeholders, sectors and communities.
The Bolsover Health and Wellbeing Partnership works alongside the NHS Place Alliance and other organisations in the area to reduce health inequalities. Sub groups like the Financial Inclusion Group and Children and Young People’s Resilience group enable collaboration on specific areas of focus.
Bolsover District Council along side the Bolsover Health and Wellbeing Partnership are committeed to supporting the long-term sustainability of Bolsover CVS to ensure the CVS is at the heart of these partnerships and we get much needed improvements of local VCSE infrastructure. A thriving community sector is key to addressing the complex, overlapping wellbeing challenges.
Led by BCVS the Bolsover Compass pilot brought together partners from schools, community organisations, Bolsover District Council, Derbyshire County Council, Public Health and Walk Derbyshire. Community organisations designed and delivered activity for the project using evidence gathered through community engagement. The approach helped to build trusted relationships across partners and has created strong foundations for future work.
 Latest Derbyshire Data
| IMD by Area | |||||||||||
|---|---|---|---|---|---|---|---|---|---|---|---|
| Local Authority | 1 - Most deprived | 2 | 3 | 4 | 5 | 6 | 7 | 8 | 9 | 10 - Least deprived | Total |
| Amber Valley | 4,716 | 8,508 | 11,266 | 8,920 | 26,013 | 9,625 | 16,559 | 16,122 | 17,856 | 9,244 | 128,829 |
| Bolsover | 2,912 | 14,754 | 15,950 | 15,830 | 11,419 | 8,497 | 1,723 | 8,660 | 1,560 | 0 | 81,305 |
| Chesterfield | 9,500 | 21,344 | 15,412 | 13,405 | 10,405 | 5,056 | 11,473 | 3,029 | 9,819 | 5,487 | 104,930 |
| Derbyshire Dales | 1,641 | 0 | 0 | 0 | 8,152 | 11,734 | 10,935 | 12,723 | 18,143 | 9,094 | 72,422 |
| Erewash | 6,010 | 10,670 | 17,801 | 3,670 | 11,476 | 9,793 | 16,825 | 10,670 | 10,906 | 17,511 | 115,332 |
| High Peak | 4,251 | 1,466 | 3,753 | 10,645 | 11,985 | 7,543 | 8,879 | 21,780 | 12,454 | 9,877 | 92,633 |
| North East Derbyshire | 5,237 | 5,111 | 9,503 | 12,116 | 11,182 | 10,868 | 13,186 | 7,878 | 16,057 | 11,078 | 102,216 |
| South Derbyshire | 0 | 5,617 | 4,759 | 4,539 | 16,952 | 14,589 | 8,444 | 20,263 | 15,741 | 18,612 | 109,516 |
| Derbyshire County | 34,267 | 67,470 | 78,444 | 69,125 | 107,584 | 77,705 | 88,024 | 101,125 | 102,536 | 80,903 | 807,183 |
| Source: Ministry of Housing, Communities and Local Government IMD 2019, ONS LA mid-year population estimates 2020 | |||||||||||
| IMD by Area | |||||||||||
|---|---|---|---|---|---|---|---|---|---|---|---|
| Local Authority | 1 - Most deprived | 2 | 3 | 4 | 5 | 6 | 7 | 8 | 9 | 10 - Least deprived | Total |
| Amber Valley | 3.7 | 6.6 | 8.7 | 6.9 | 20.2 | 7.5 | 12.9 | 12.5 | 13.9 | 7.2 | 100.0 |
| Bolsover | 3.6 | 18.1 | 19.6 | 19.5 | 14.0 | 10.5 | 2.1 | 10.7 | 1.9 | 0.0 | 100.0 |
| Chesterfield | 9.1 | 20.3 | 14.7 | 12.8 | 9.9 | 4.8 | 10.9 | 2.9 | 9.4 | 5.2 | 100.0 |
| Derbyshire Dales | 2.3 | 0.0 | 0.0 | 0.0 | 11.3 | 16.2 | 15.1 | 17.6 | 25.1 | 12.6 | 100.0 |
| Erewash | 5.2 | 9.3 | 15.4 | 3.2 | 10.0 | 8.5 | 14.6 | 9.3 | 9.5 | 15.2 | 100.0 |
| High Peak | 4.6 | 1.6 | 4.1 | 11.5 | 12.9 | 8.1 | 9.6 | 23.5 | 13.4 | 10.7 | 100.0 |
| North East Derbyshire | 5.1 | 5.0 | 9.3 | 11.9 | 10.9 | 10.6 | 12.9 | 7.7 | 15.7 | 10.8 | 100.0 |
| South Derbyshire | 0.0 | 5.1 | 4.3 | 4.1 | 15.5 | 13.3 | 7.7 | 18.5 | 14.4 | 17.0 | 100.0 |
| Derbyshire County | 4.2 | 8.4 | 9.7 | 8.6 | 13.3 | 9.6 | 10.9 | 12.5 | 12.7 | 10.0 | 100.0 |
| Source: Ministry of Housing, Communities and Local Government IMD 2019, ONS LA mid-year population estimates 2020 | |||||||||||
| Population by Ethnicity (percentage) | |||||
|---|---|---|---|---|---|
| Area | Asian, Asian British or Asian Welsh | Black, Black British, Black Welsh, Caribbean or African | Mixed or Multiple ethnic groups | White | Other ethnic group |
| England | 9.6 | 4.2 | 3.0 | 81.0 | 2.2 |
| Derby | 15.6 | 4.0 | 3.7 | 73.8 | 2.9 |
| Derbyshire | 1.5 | 0.5 | 1.4 | 96.3 | 0.3 |
| Amber Valley | 1.0 | 0.3 | 1.2 | 97.3 | 0.2 |
| Bolsover | 0.9 | 0.5 | 0.9 | 97.4 | 0.3 |
| Chesterfield | 1.9 | 0.8 | 1.4 | 95.5 | 0.4 |
| Derbyshire Dales | 0.7 | 0.2 | 1.0 | 97.8 | 0.3 |
| Erewash | 1.6 | 0.8 | 1.8 | 95.4 | 0.4 |
| High Peak | 0.8 | 0.2 | 1.3 | 97.4 | 0.2 |
| North East Derbyshire | 0.9 | 0.3 | 1.1 | 97.4 | 0.2 |
| South Derbyshire | 3.6 | 0.8 | 1.8 | 93.1 | 0.7 |
| Source: Census 2021 | |||||
Trend Data
The following charts show life expectancy over time in Derbyshire by district and sex (compared to England)
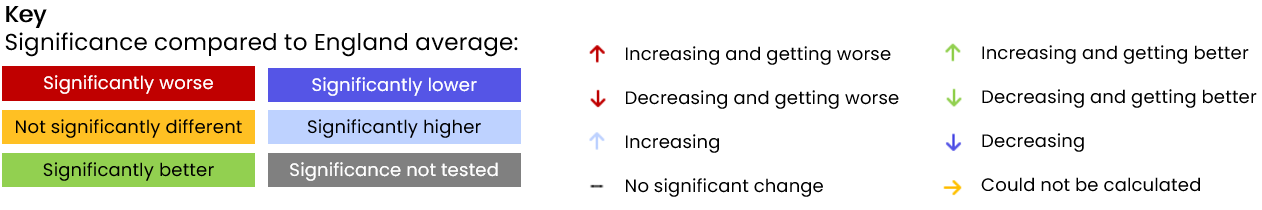
PHOF Profile
Notes:
- For indicators that aren’t straightforward to determine whether a high value is good or bad are shaded in blue rather than red/amber/green.
- Recent trend refers to analysis done by Fingertips which tests for a statistical trend. Please see the Fingertips tool for full details.
- Increases and decreases are only shown if they are statistically significant.
| A. Overarching indicators | ||||||||
|---|---|---|---|---|---|---|---|---|
| Indicator | Age | Sex | Period | Value | East Midlands region | England | Unit | Recent Trend |
| A01b - Life expectancy at birth | All ages | Male | 2023 | 77.0 | 78.9 | Inf | Years | |
| A01b - Life expectancy at birth | All ages | Male | 2021 - 23 | 76.9 | 78.8 | Inf | Years | |
| A01b - Life expectancy at birth | All ages | Female | 2023 | 81.5 | 82.7 | Inf | Years | |
| A01b - Life expectancy at birth | All ages | Female | 2021 - 23 | 80.6 | 82.6 | Inf | Years | |
| A02a - Inequality in life expectancy at birth | All ages | Male | 2021 - 23 | 8.4 | 10.1 | 10.5 | Years | |
| A02a - Inequality in life expectancy at birth | All ages | Female | 2021 - 23 | 4.4 | 7.9 | 8.3 | Years | |
| A01b - Life expectancy at 65 | 65 | Male | 2023 | 17.4 | 18.6 | 18.8 | Years | |
| A01b - Life expectancy at 65 | 65 | Male | 2021 - 23 | 17.3 | 18.5 | 18.7 | Years | |
| A01b - Life expectancy at 65 | 65 | Female | 2023 | 19.8 | 20.9 | 21.3 | Years | |
| A01b - Life expectancy at 65 | 65 | Female | 2021 - 23 | 19.4 | 20.8 | 21.1 | Years | |
| A02a - Inequality in life expectancy at 65 | 65 | Male | 2021 - 23 | 3.5 | 5.3 | 5.6 | Years | |
| A02a - Inequality in life expectancy at 65 | 65 | Female | 2021 - 23 | 3.2 | 4.8 | 5.0 | Years | |
| Source: OHID Fingertips | ||||||||
| B. Wider Determinants of Health | ||||||||
|---|---|---|---|---|---|---|---|---|
| Indicator | Age | Sex | Period | Value | East Midlands region | England | Unit | Recent Trend |
| B01b - Children in absolute low income families (under 16s) | <16 yrs | Persons | 2023/24 | 23.8 | 20.7 | 19.1 | % | |
| B01b - Children in relative low income families (under 16s) | <16 yrs | Persons | 2023/24 | 27.6 | 24.1 | 22.1 | % | |
| B03 - Pupil absence | 5-15 yrs | Persons | 2023/24 | 7.6 | 7.1 | 7.1 | % | |
| B08d - Percentage of people in employment | 16-64 yrs | Persons | 2023/24 | 77.6 | 75.4 | 75.7 | % | |
| B09a - Sickness absence: the percentage of employees who had at least one day off in the previous week | 16+ yrs | Persons | 2021 - 23 | NA | 2.1 | 2.2 | % | |
| B09b - Sickness absence: the percentage of working days lost due to sickness absence | 16+ yrs | Persons | 2021 - 23 | NA | 1.3 | 1.2 | % | |
| B12a - Violent crime - hospital admissions for violence (including sexual violence) | All ages | Persons | 2021/22 - 23/24 | 33.8 | 28.8 | 34.2 | per 100,000 | |
| B12b - Violent crime - violence offences per 1,000 population | All ages | Persons | 2023/24 | 33.2 | 31.7 | 32.7 | per 1,000 | |
| B12c - Violent crime - sexual offences per 1,000 population | All ages | Persons | 2023/24 | 2.8 | 3.0 | 2.9 | per 1,000 | |
| B13a - Reoffending levels: percentage of offenders who reoffend | All ages | Persons | 2022/23 | 20.7 | 27.6 | 26.2 | % | |
| B13b - Reoffending levels: average number of reoffences per reoffender | All ages | Persons | 2022/23 | 2.4 | 4.2 | 4.0 | per re-offender | |
| B14a - The rate of complaints about noise | All ages | Persons | 2023/24 | 3.7 | 5.3 | 5.9 | per 1,000 | |
| B14b - The percentage of the population exposed to road, rail and air transport noise of 65dB(A) or more, during the daytime | All ages | Persons | 2021 | 2.0 | 3.0 | 4.3 | % | |
| B14c - The percentage of the population exposed to road, rail and air transport noise of 55 dB(A) or more during the night-time | All ages | Persons | 2021 | 5.4 | 6.2 | 8.4 | % | |
| B15a - Homelessness: households owed a duty under the Homelessness Reduction Act | Not applicable | Not applicable | 2023/24 | 8.1 | 11.2 | 13.4 | per 1,000 | |
| B15c - Homelessness: households in temporary accommodation | Not applicable | Not applicable | 2023/24 | 0.2 | 1.6 | 4.6 | per 1,000 | |
| B17 - Fuel poverty (low income, low energy efficiency methodology) | Not applicable | Not applicable | 2023 | 13.8 | 11.7 | 11.4 | % | |
| 1.01i - Children in low income families (all dependent children under 20) | 0-19 yrs | Persons | 2016 | 19.3 | 16.3 | 17.0 | % | |
| Source: OHID Fingertips | ||||||||
| C. Health Improvement | ||||||||
|---|---|---|---|---|---|---|---|---|
| Indicator | Age | Sex | Period | Value | East Midlands region | England | Unit | Recent Trend |
| C01 - Total prescribed LARC excluding injections rate / 1,000 | All ages | Female | 2023 | 60.3 | 45.7 | 43.5 | per 1,000 | |
| C04 - Low birth weight of term babies | >=37 weeks gestational age at birth | Persons | 2022 | 3.9 | 2.6 | 2.9 | % | |
| C06 - Smoking status at time of delivery | All ages | Female | 2023/24 | 8.9 | 9.9 | 7.4 | % | |
| C09a - Reception prevalence of overweight (including obesity) | 4-5 yrs | Persons | 2023/24 | 25.9 | 22.0 | 22.1 | % | |
| C09b - Year 6 prevalence of overweight (including obesity) | 10-11 yrs | Persons | 2023/24 | 40.6 | 36.0 | 35.8 | % | |
| C10 - Percentage of physically active children and young people | 5-16 yrs | Persons | 2023/24 | 44.9 | 45.7 | 47.8 | % | |
| C11a - Hospital admissions caused by unintentional and deliberate injuries in children (aged 0 to 14 years) | <15 yrs | Persons | 2023/24 | 60.0 | 54.9 | 72.7 | per 10,000 | |
| C11a - Hospital admissions caused by unintentional and deliberate injuries in children (aged 0 to 4 years) | 0-4 yrs | Persons | 2023/24 | 70.5 | 68.3 | 93.2 | per 10,000 | |
| C11b - Hospital admissions caused by unintentional and deliberate injuries in young people (aged 15 to 24 years) | 15-24 yrs | Persons | 2023/24 | 93.3 | 79.2 | 88.6 | per 10,000 | |
| C14b - Emergency Hospital Admissions for Intentional Self-Harm | All ages | Persons | 2023/24 | 139.0 | 128.1 | 117.0 | per 100,000 | |
| C15 - Percentage of adults meeting the '5-a-day' fruit and vegetable consumption recommendations (new method) | 16+ yrs | Persons | 2023/24 | 24.7 | 30.1 | 31.3 | % | |
| C15 - Proportion of the population meeting the recommended '5 a day' on a 'usual day' (adults) (old method) | 16+ yrs | Persons | 2019/20 | 49.2 | 55.0 | 55.4 | % | |
| C16 - Overweight (including obesity) prevalence in adults, (using adjusted self-reported height and weight) | 18+ yrs | Persons | 2023/24 | 74.1 | 67.1 | 64.5 | % | |
| C17a - Percentage of physically active adults | 19+ yrs | Persons | 2023/24 | 66.9 | 66.7 | 67.4 | % | |
| C17b - Percentage of physically inactive adults | 19+ yrs | Persons | 2023/24 | 24.3 | 22.7 | 22.0 | % | |
| C18 - Smoking Prevalence in adults (aged 18 and over) - current smokers (APS) | 18+ yrs | Persons | 2023 | 17.3 | 12.5 | 11.6 | % | |
| C19d - Deaths from drug misuse | All ages | Persons | 2021 - 23 | 10.4 | 5.4 | 5.5 | per 100,000 | |
| C21 - Admission episodes for alcohol-related conditions (Narrow) | All ages | Persons | 2023/24 | 676.6 | 553.6 | 504.1 | per 100,000 | |
| C21 - Admission episodes for alcohol-related conditions (Narrow) | All ages | Male | 2023/24 | 859.0 | 724.9 | 686.5 | per 100,000 | |
| C21 - Admission episodes for alcohol-related conditions (Narrow) | All ages | Female | 2023/24 | 510.9 | 396.8 | 339.5 | per 100,000 | |
| C22 - Estimated diabetes diagnosis rate | 17+ yrs | Persons | 2018 | 97.2 | 84.6 | 78.0 | % | |
| C23 - Percentage of cancers diagnosed at stages 1 and 2 | All ages | Persons | 2021 | 50.6 | 52.9 | 54.4 | % | |
| C24a - Cancer screening coverage: breast cancer | 53-70 yrs | Female | 2024 | 74.2 | 71.2 | 69.9 | % | |
| C24b - Cancer screening coverage: cervical cancer (aged 25 to 49 years old) | 25-49 yrs | Female | 2024 | 75.1 | 68.2 | 66.1 | % | |
| C24c - Cancer screening coverage: cervical cancer (aged 50 to 64 years old) | 50-64 yrs | Female | 2024 | 77.1 | 75.8 | 74.3 | % | |
| C24d - Cancer screening coverage: bowel cancer | 60-74 yrs | Persons | 2024 | 71.9 | 72.9 | 71.8 | % | |
| C24e - Abdominal Aortic Aneurysm Screening Coverage | 65 | Male | 2023/24 | 87.0 | 86.2 | 81.9 | % | |
| C27 - Percentage reporting a long-term Musculoskeletal (MSK) problem | 16+ yrs | Persons | 2023 | 22.5 | 20.0 | 18.4 | % | |
| C28a - Self reported wellbeing: people with a low satisfaction score | 16+ yrs | Persons | 2022/23 | NA | 6.5 | 5.6 | % | |
| C28b - Self reported wellbeing: people with a low worthwhile score | 16+ yrs | Persons | 2022/23 | NA | 4.4 | 4.4 | % | |
| C28c - Self reported wellbeing: people with a low happiness score | 16+ yrs | Persons | 2022/23 | 13.1 | 9.3 | 8.8 | % | |
| C28d - Self reported wellbeing: people with a high anxiety score | 16+ yrs | Persons | 2022/23 | 21.2 | 21.5 | 23.3 | % | |
| C29 - Emergency hospital admissions due to falls in people aged 65 and over | 65+ yrs | Persons | 2023/24 | 1,671.9 | 1,908.5 | 1,984.0 | per 100,000 | |
| C29 - Emergency hospital admissions due to falls in people aged 65 to 79 | 65-79 yrs | Persons | 2023/24 | 888.0 | 908.4 | 954.7 | per 100,000 | |
| C29 - Emergency hospital admissions due to falls in people aged 80 plus | 80+ yrs | Persons | 2023/24 | 3,945.3 | 4,808.6 | 4,968.9 | per 100,000 | |
| Source: OHID Fingertips | ||||||||
| D. Health Protection | ||||||||
|---|---|---|---|---|---|---|---|---|
| Indicator | Age | Sex | Period | Value | East Midlands region | England | Unit | Recent Trend |
| D01 - Air pollution: estimated fraction of mortality attributable to particulate air pollution | 30+ yrs | Persons | 2023 | 5.6 | 5.6 | 5.2 | % | |
| D02a - Chlamydia detection rate per 100,000 aged 15 to 24 years | 15-24 yrs | Male | 2024 | 1,018.4 | 908.7 | 837.2 | per 100,000 | |
| D02a - Chlamydia detection rate per 100,000 aged 15 to 24 years | 15-24 yrs | Female | 2024 | 1,594.4 | 1,775.4 | 1,589.4 | per 100,000 | |
| D02a - Chlamydia detection rate per 100,000 aged 15 to 24 years | 15-24 yrs | Persons | 2024 | 1,330.8 | 1,351.5 | 1,249.8 | per 100,000 | |
| D02b - New STI diagnoses (excluding chlamydia aged 24 and under) per 100,000 | All ages | Persons | 2024 | 334.4 | 313.5 | 482.3 | per 100,000 | |
| D07 - HIV late diagnosis in people first diagnosed with HIV in the UK | 15+ yrs | Persons | 2021 - 23 | 40.0 | 47.5 | 43.5 | % | |
| D08a - Proportion of drug sensitive TB notifications who had completed a full course of treatment by 12 months | All ages | Persons | 2022 | 100.0 | 76.5 | 82.8 | % | |
| D08b - TB incidence (three year average) | All ages | Persons | 2021 - 23 | 4.9 | 7.7 | 8.0 | per 100,000 | |
| D10 - Adjusted antibiotic prescribing in primary care by the NHS | All ages | Persons | 2023 | 1.1 | 0.9 | 0.9 | per STAR-PU | |
| Source: OHID Fingertips | ||||||||
| E. Healthcare and Premature Mortality | ||||||||
|---|---|---|---|---|---|---|---|---|
| Indicator | Age | Sex | Period | Value | East Midlands region | England | Unit | Recent Trend |
| E01 - Infant mortality rate | <1 yr | Persons | 2021 - 23 | 3.4 | 4.4 | 4.1 | per 1,000 | |
| E02 - Percentage of 5 year olds with experience of visually obvious dental decay | 5 yrs | Persons | 2023/24 | 16.8 | 21.5 | 22.4 | % | |
| E03 - Under 75 mortality rate from causes considered preventable | <75 yrs | Persons | 2023 | 207.7 | 161.7 | 153.0 | per 100,000 | |
| E03 - Under 75 mortality rate from causes considered preventable | <75 yrs | Persons | 2021 - 23 | 226.9 | 170.1 | 163.7 | per 100,000 | |
| E04a - Under 75 mortality rate from cardiovascular disease | <75 yrs | Persons | 2023 | 96.0 | 80.3 | 77.4 | per 100,000 | |
| E04a - Under 75 mortality rate from cardiovascular disease | <75 yrs | Persons | 2021 - 23 | 91.2 | 80.6 | 77.1 | per 100,000 | |
| E04b - Under 75 mortality rate from cardiovascular disease considered preventable | <75 yrs | Persons | 2021 - 23 | 35.8 | 32.5 | 30.5 | per 100,000 | |
| E05a - Under 75 mortality rate from cancer | <75 yrs | Persons | 2023 | 154.4 | 126.4 | 120.8 | per 100,000 | |
| E05a - Under 75 mortality rate from cancer | <75 yrs | Persons | 2021 - 23 | 152.2 | 125.9 | 121.6 | per 100,000 | |
| E05b - Under 75 mortality rate from cancer considered preventable | <75 yrs | Persons | 2021 - 23 | 68.3 | 50.5 | 49.5 | per 100,000 | |
| E06a - Under 75 mortality rate from liver disease | <75 yrs | Persons | 2023 | 40.5 | 23.6 | 21.9 | per 100,000 | |
| E06a - Under 75 mortality rate from liver disease | <75 yrs | Persons | 2021 - 23 | 35.5 | 22.4 | 21.5 | per 100,000 | |
| E06b - Under 75 mortality rate from liver disease considered preventable | <75 yrs | Persons | 2021 - 23 | 33.3 | 20.2 | 19.2 | per 100,000 | |
| E07a - Under 75 mortality rate from respiratory disease | <75 yrs | Persons | 2023 | 38.9 | 33.2 | 33.7 | per 100,000 | |
| E07a - Under 75 mortality rate from respiratory disease | <75 yrs | Persons | 2021 - 23 | 39.9 | 29.4 | 30.3 | per 100,000 | |
| E07b - Under 75 mortality rate from respiratory disease considered preventable | <75 yrs | Persons | 2021 - 23 | 24.3 | 17.8 | 18.0 | per 100,000 | |
| E08 - Mortality rate from a range of specified communicable diseases, including influenza | All ages | Persons | 2021 - 23 | 16.4 | 12.1 | 13.0 | per 100,000 | |
| E10 - Suicide rate | 10+ yrs | Persons | 2021 - 23 | 10.2 | 11.3 | 10.7 | per 100,000 | |
| E11 - Emergency readmissions within 30 days of discharge from hospital | All ages | Persons | 2023/24 | 16.5 | 14.8 | 14.8 | % | |
| E13 - Hip fractures in people aged 65 and over | 65+ yrs | Persons | 2023/24 | 535.7 | 556.0 | 547.1 | per 100,000 | |
| E13 - Hip fractures in people aged 65 to 79 | 65-79 yrs | Persons | 2023/24 | 249.7 | 240.7 | 237.8 | per 100,000 | |
| E13 - Hip fractures in people aged 80 and over | 80+ yrs | Persons | 2023/24 | 1,365.0 | 1,470.3 | 1,443.8 | per 100,000 | |
| E14 - Winter mortality index | All ages | Persons | Aug 2021 - Jul 2022 | 18.7 | 6.5 | 8.1 | % | |
| E14 - Winter mortality index (age 85 plus) | 85+ yrs | Persons | Aug 2021 - Jul 2022 | 26.0 | 8.5 | 11.3 | % | |
| E15 - Estimated dementia diagnosis rate (aged 65 and older) | 65+ yrs | Persons | 2025 | 75.0 | 67.8 | 65.6 | per 100 | |
| Source: OHID Fingertips | ||||||||
Prevalence Maps of Derbyshire
The maps below illustrate various geographies for Derbyshire. LSOAs and MSOAs are geographical divisions used for statistical purposes, allowing for more detailed analysis of local data. In these maps, you can explore various health indicators and data for Derbyshire, providing valuable insights into the area’s health and wellbeing.
 |
In the top right of the map, you’ll find the ‘Layer Control’ icon. This is an easy way to customise what you see on the map visualisation. Click the ‘Layer Control’ to choose which information is displayed on the map. Pick the indicator that interests you the most, and the map will transform accordingly. |
 Further Analysis & Assessments
Derbyshire Joint Strategic Needs Assessment (JSNA) involves a thorough examination of a specific health problem, exploring its causes, consequences, and underlying factors. It combines various data sources, collaboration with stakeholders, and rigorous analysis to generate insights for evidence-informed interventions and policy changes.
 More Information & Resources
Contributors
Helen Heath, Service Development Officer - Bolsover