| Population by Age and Area | ||||
|---|---|---|---|---|
| Area | 0 - 15 years | 16 - 64 years | 65+ years | Total |
| Derby | 54,956 | 174,676 | 44,517 | 274,149 |
| Derbyshire | 137,322 | 499,035 | 186,020 | 822,377 |
| Amber Valley | 21,569 | 78,858 | 30,024 | 130,451 |
| Bolsover | 14,300 | 52,218 | 17,255 | 83,773 |
| Chesterfield | 17,604 | 64,755 | 23,686 | 106,045 |
| Derbyshire Dales | 10,111 | 40,615 | 21,031 | 71,757 |
| Erewash | 19,174 | 70,825 | 24,254 | 114,253 |
| High Peak | 14,973 | 55,690 | 21,296 | 91,959 |
| North East Derbyshire | 17,684 | 62,527 | 26,435 | 106,646 |
| South Derbyshire | 21,907 | 73,547 | 22,039 | 117,493 |
| Source: Mid-year estimates 2024 | ||||
Erewash
Locality
Erewash
Diabetes
Dementia
Smoking
Ageing Population
Demographics

 Introduction
Erewash is a local government district and borough located in eastern Derbyshire, lying between the cities of Derby and Nottingham. It forms part of the Nottingham Urban Area in its eastern section. The district has a rich and diverse history shaped by its industrial past, transport links, and position on the Derbyshire–Nottinghamshire border.
Formed in 1974 under the Local Government Act, the modern Borough of Erewash combines areas with centuries of heritage rooted in coal mining, lace and textile manufacturing, and canal and rail transport. The Bennerley Viaduct, a rare surviving wrought-iron railway viaduct, remains a symbol of the area’s industrial legacy.
Erewash has a population of approximately 112,900, with around 70% living in the two main market towns: Ilkeston and Long Eaton. The remainder reside in smaller settlements scattered across more rural parts of the borough. The district has the second highest number of households among Derbyshire districts, with a total of approximately 52,000.
A key demographic feature is its ageing population, with a growing proportion of residents aged 65 and over. Erewash is economically diverse, comprising both relatively affluent areas and communities facing significant socio-economic challenges.
The local authority is Erewash Borough Council. Politically, the area is represented by two parliamentary constituencies: Erewash and Mid Derbyshire.
Historically, the economy was built on coal mining and the lace/textile industry, particularly in Ilkeston and Long Eaton. Today, employment is primarily service-based, with key sectors including retail, healthcare, and education. Many residents commute to nearby Derby and Nottingham for work.
Erewash has multiple secondary schools, and further education opportunities are provided by colleges in nearby Derby and Nottingham.
The borough is home to notable landmarks such as the Erewash Canal, Victoria Park, and various listed heritage sites. Ilkeston Charter Fair, granted a charter in 1252, is one of the oldest fairs in England and remains a major annual event.
Erewash is more deprived than the national average and ranks within the top 20% most deprived areas in England. This is particularly evident in certain communities, such as Cotmanhay, which is the most deprived ward in the borough and parts of which rank amongst the most deprived 10% nationally.
These figures highlight significant localised inequalities and areas in need of targeted support.
Healthcare is delivered through a combination of NHS services, primary care, community-based programs, and voluntary sector support. Services are shaped by the structure of the national NHS but are adapted to local needs via the Joined Up Care Derbyshire Integrated Care System (ICS).
The borough is primarily served by the Erewash & West Hallam Primary Care Network (PCN), which covers a population of approximately 102,000, alongside the smaller Oakdale Park PCN which covers the Borrowash and Ockbrook area. There is no major acute hospital in Erewash. Residents access hospital care at:
- Royal Derby Hospital (Derby)
- Queen’s Medical Centre (Nottingham)
- Nottingham City Hospital
Ilkeston Community Hospital provides local outpatient clinics, diagnostics, minor injury services, and rehabilitation.
Mental health services are delivered by Derbyshire Healthcare NHS Foundation Trust, with additional support from charities and community-based providers. Preventative and community health services are commissioned through Joined Up Care Derbyshire, focusing on integrated, place-based care.

WARD REFERENCE
01: Awsworth Road
02: Breaston
03: Cotmanhay
04: Derby Road East
05: Derby Road West
06: Draycott & Risley
07: Hallam Fields
08: Kirk Hallam & Stanton-by-Dale
09: Larklands
10: Little Eaton & Stanley
11: Little Hallam
12: Long Eaton Central
13: Nottingham Road
14: Ockbrook & Borrowash
15: Sandiacre
16: Sawley
17: Shipley View
18: West Hallam & Dale Abbey
19: Wilsthorpe
 Why is it important to Population Health?
Health inequalities are avoidable and unfair differences in health outcomes across populatuions. They impact individuals their communities and wider society. They limit the potential of an individual, increase healthcare costs and create economic burden.
Health inequalities in Erewash are a major public health concern, mirroring both national and regional disparities. Although the borough includes a mix of urban and rural areas, there are stark differences in health outcomes between affluent communities and more deprived areas such as Cotmanhay, Kirk Hallam, and parts of Ilkeston.
Residents in deprived wards experience significantly fewer years of good health compared to those in wealthier neighborhoods, with a life expectancy gap of approximately 8 to 10 years between the most and least deprived areas. Erewash also has elevated rates of cardiovascular disease, COPD, type 2 diabetes, and obesity, alongside the high smoking prevalence.
The borough’s ageing population, particularly those living alone or on low incomes, faces increased risks of social isolation, falls, poor nutrition, and multiple long-term health conditions. Access to vital services such as reablement, social care, and preventative screenings can be inconsistent across the area.
Unemployment in Erewash reflects wider trends in Derbyshire and the East Midlands but is notably higher in deprived wards like Cotmanhay, Kirk Hallam, and parts of Ilkeston and Long Eaton. While the overall unemployment rate is close to the national average, economic inactivity, long-term unemployment, and youth unemployment are significantly elevated in the most deprived neighborhoods. Youth unemployment in Erewash surpasses both regional and national averages.
According to the Index of Multiple Deprivation (IMD), Erewash ranks within the top 20% most deprived areas in England.
 The Derbyshire Population Health Approach
The Derbyshire Population Health Approach focuses on prevention, population health, evidence-informed practices, causes, and collaboration. It emphasises proactive measures to prevent health issues, tailors interventions to specific populations, incorporates evidence-informed practices, addresses underlying causes, and promotes collaboration for effective action.
When considering Erewash within The Derbyshire Population Health Approach:
• Prevention
The Erewash Health and Wellbeing Partnership is a long-established group of local partners working together with the aim of improving health and wellbeing and reducing inequality for people living in Erewash
Building on a history of local asset-based community development initiatives and with buy-in from local partners for a bigger change, since 2020, the Partnership has committed to a locally defined community wellness approach based on the key principles of trusting communities and local decision making.
Using a community network model the approach relies upon asset-based community development principles; a belief that people living in community are best placed to drive sustainable change, supported by a senior level commitment to devolving power to create system change. This approach seeks a fundamental change in the power balance and requires the building of authentic and trusting relationships between service providers and the communities they serve.
The approach is led by 5 place-based community networks (Petersham, Kirk Hallam, Cotmanhay, Sawley and Sandiacre) representing the areas with the highest levels of deprivation and includes devolving decision making on funding priorities and distribution.
The HWP funds three community activators whose role it is to support the development of these networks and engage local residents.
Each Community Network is responsible for designing its own action plan in line with its communities needs. Devolved funding is then used by each of the networks to meet these needs.
• Population
Health inequalities in Erewash are largely driven by socioeconomic deprivation, with the most affected populations experiencing worse physical and mental health, shorter life expectancy, and reduced access to care. Tackling these disparities requires targeted public health initiatives, improved access to services, and broader socioeconomic support.
While Erewash’s overall deprivation score is lower than the national average, it contains four of Derbyshire’s most deprived areas, particularly in Ilkeston and Long Eaton.
These pockets of deprivation contribute to significant health disparities, with residents in the most deprived areas experiencing shorter life expectancy and higher rates of chronic diseases
Approximately 17.2% of children in Erewash live in low-income families, highlighting socioeconomic challenges that can impact long-term health outcomes.
Deprived communities in Erewash report higher instances of mental health issues, including depression and anxiety.
There is also a higher prevalence of chronic conditions such as diabetes and cardiovascular diseases in these areas.
• Evidence
The Community wellness Approach is underpinned by evidence and the broader strategic direction of the health system.
The 2020 Marmot review articulated the connection between social inequalities and inequality in health outcomes. Enabling people to have greater control over their lives by creating and developing healthy and sustainable places and communities were recommendations in the report.
Formed in 2022 the ICS are tasked with developing stronger partnerships outside of the system incl the VCSE sector, housing and education with a focus on population health and reducing health inequalities
The Health & Care Act 2022 recognises that collaboration is required to improve local services and create better outcomes.
• Causes
Understanding and addressing health inequalities are at the centre of population level approaches to support people to live healthier lives. There are a wide range of causes that contribute to these inequalities and devolving decision making and funding to the five community networks ensures that local communities themselves are at the heart of this process in Erewash.
This insight allows the partnership to recognise the causes of poor health that the communities themselves identify. Issues highlighted include social isolation, digital and financial exclusion, transport challenges when accessing services, poor mental health and a need for more safe spaces for young people.
Examples of this work include:
A youth-led project for 14–19-year-olds that fostered community cohesion, reduced antisocial behaviour, and improved mental well-being through football and peer support. Over 20 local teens engaged, leading to positive outcomes including school re-engagement, reduced drug use, and employment. Originally a 4-week initiative, it expanded to 4 months due to high demand, and has inspired a new year-long youth hangout launching in May.
The Kirk Hallam Warm Welcome Lunch Club provided door-to-door transport to help isolated seniors attend the Cat and Fiddle Lunch Club, significantly increasing participation and reducing loneliness. The initiative eliminated mobility barriers and proved that simple support like transport can profoundly improve wellbeing and social connection.
The Erewash Financial Inclusion Group, in partnership with the Independent Food Aid Network, has produced a ‘Worrying About Money’ leaflet and digital resource to provide vital financial advice and support for those struggling to make ends meet. The initiative has been made possible through support from multiple partners
Erewash PCN has co-produced and delivered Community Healthy Heart Checks in collaboration with several local community groups across Erewash. The aim was to design these clinics alongside community members to ensure they were accessible, relevant, and effective. The clinics offered checks for blood pressure, cholesterol (lipids), and atrial fibrillation (AF).
A key element of the initiative was working closely with LLBD to provide individuals with the opportunity to discuss lifestyle choices and explore ways to improve or maintain their health. Recognising working-age men as an underrepresented group, we partnered with Travis Perkins in Long Eaton to host a targeted event offering Healthy Heart Checks and lifestyle advice. These events identified cardiovascular abnormalities in approximately 63% of participants, all of whom were referred for follow-up.
Building on this success, we are now planning a series of Healthy Bodies and Minds community events. These will involve a wider range of partners and include additional services such as mental health support and bowel screening.
Sport England Place Partnership work in Erewash (focused on Kirk Hallam). With a focus around Education, Youth Voice and Community Empowerment. The local partnership team working closely with residents are starting to see a pathway where future investment may enable increased physical activity. Much of the work entails taking a ‘system wide approach’ to working which means organisations working more closely and more strategically together, rather than in silos and delivering short term initiatives and investing.
• Collaboration
The locality approach in Erewash is about working in partnership with our local communities and the services that support them to address health inequalities and improve outcomes.
At the heart of the locality programme are the five community networks surrounded by a wide range of partners that collaborate by supporting a shared vision.
All of these relationships are built on trust and an understanding that communities themselves are best placed to identify their own challenges and design their own solutions.
The partnership supporting this work include Erewash Borough Council, Erewash Voluntary Action, Place Alliance, PCN, Children’s Services and a wide range of voluntary and community organisations alongside Community Safety, Active Erewash, GPs, and many others.
 Latest Derbyshire Data
| IMD by Area | |||||||||||
|---|---|---|---|---|---|---|---|---|---|---|---|
| Local Authority | 1 - Most deprived | 2 | 3 | 4 | 5 | 6 | 7 | 8 | 9 | 10 - Least deprived | Total |
| Amber Valley | 4,716 | 8,508 | 11,266 | 8,920 | 26,013 | 9,625 | 16,559 | 16,122 | 17,856 | 9,244 | 128,829 |
| Bolsover | 2,912 | 14,754 | 15,950 | 15,830 | 11,419 | 8,497 | 1,723 | 8,660 | 1,560 | 0 | 81,305 |
| Chesterfield | 9,500 | 21,344 | 15,412 | 13,405 | 10,405 | 5,056 | 11,473 | 3,029 | 9,819 | 5,487 | 104,930 |
| Derbyshire Dales | 1,641 | 0 | 0 | 0 | 8,152 | 11,734 | 10,935 | 12,723 | 18,143 | 9,094 | 72,422 |
| Erewash | 6,010 | 10,670 | 17,801 | 3,670 | 11,476 | 9,793 | 16,825 | 10,670 | 10,906 | 17,511 | 115,332 |
| High Peak | 4,251 | 1,466 | 3,753 | 10,645 | 11,985 | 7,543 | 8,879 | 21,780 | 12,454 | 9,877 | 92,633 |
| North East Derbyshire | 5,237 | 5,111 | 9,503 | 12,116 | 11,182 | 10,868 | 13,186 | 7,878 | 16,057 | 11,078 | 102,216 |
| South Derbyshire | 0 | 5,617 | 4,759 | 4,539 | 16,952 | 14,589 | 8,444 | 20,263 | 15,741 | 18,612 | 109,516 |
| Derbyshire County | 34,267 | 67,470 | 78,444 | 69,125 | 107,584 | 77,705 | 88,024 | 101,125 | 102,536 | 80,903 | 807,183 |
| Source: Ministry of Housing, Communities and Local Government IMD 2019, ONS LA mid-year population estimates 2020 | |||||||||||
| IMD by Area | |||||||||||
|---|---|---|---|---|---|---|---|---|---|---|---|
| Local Authority | 1 - Most deprived | 2 | 3 | 4 | 5 | 6 | 7 | 8 | 9 | 10 - Least deprived | Total |
| Amber Valley | 3.7 | 6.6 | 8.7 | 6.9 | 20.2 | 7.5 | 12.9 | 12.5 | 13.9 | 7.2 | 100.0 |
| Bolsover | 3.6 | 18.1 | 19.6 | 19.5 | 14.0 | 10.5 | 2.1 | 10.7 | 1.9 | 0.0 | 100.0 |
| Chesterfield | 9.1 | 20.3 | 14.7 | 12.8 | 9.9 | 4.8 | 10.9 | 2.9 | 9.4 | 5.2 | 100.0 |
| Derbyshire Dales | 2.3 | 0.0 | 0.0 | 0.0 | 11.3 | 16.2 | 15.1 | 17.6 | 25.1 | 12.6 | 100.0 |
| Erewash | 5.2 | 9.3 | 15.4 | 3.2 | 10.0 | 8.5 | 14.6 | 9.3 | 9.5 | 15.2 | 100.0 |
| High Peak | 4.6 | 1.6 | 4.1 | 11.5 | 12.9 | 8.1 | 9.6 | 23.5 | 13.4 | 10.7 | 100.0 |
| North East Derbyshire | 5.1 | 5.0 | 9.3 | 11.9 | 10.9 | 10.6 | 12.9 | 7.7 | 15.7 | 10.8 | 100.0 |
| South Derbyshire | 0.0 | 5.1 | 4.3 | 4.1 | 15.5 | 13.3 | 7.7 | 18.5 | 14.4 | 17.0 | 100.0 |
| Derbyshire County | 4.2 | 8.4 | 9.7 | 8.6 | 13.3 | 9.6 | 10.9 | 12.5 | 12.7 | 10.0 | 100.0 |
| Source: Ministry of Housing, Communities and Local Government IMD 2019, ONS LA mid-year population estimates 2020 | |||||||||||
| Population by Ethnicity (percentage) | |||||
|---|---|---|---|---|---|
| Area | Asian, Asian British or Asian Welsh | Black, Black British, Black Welsh, Caribbean or African | Mixed or Multiple ethnic groups | White | Other ethnic group |
| England | 9.6 | 4.2 | 3.0 | 81.0 | 2.2 |
| Derby | 15.6 | 4.0 | 3.7 | 73.8 | 2.9 |
| Derbyshire | 1.5 | 0.5 | 1.4 | 96.3 | 0.3 |
| Amber Valley | 1.0 | 0.3 | 1.2 | 97.3 | 0.2 |
| Bolsover | 0.9 | 0.5 | 0.9 | 97.4 | 0.3 |
| Chesterfield | 1.9 | 0.8 | 1.4 | 95.5 | 0.4 |
| Derbyshire Dales | 0.7 | 0.2 | 1.0 | 97.8 | 0.3 |
| Erewash | 1.6 | 0.8 | 1.8 | 95.4 | 0.4 |
| High Peak | 0.8 | 0.2 | 1.3 | 97.4 | 0.2 |
| North East Derbyshire | 0.9 | 0.3 | 1.1 | 97.4 | 0.2 |
| South Derbyshire | 3.6 | 0.8 | 1.8 | 93.1 | 0.7 |
| Source: Census 2021 | |||||
Trend Data
The following charts show life expectancy over time in Derbyshire by district and sex (compared to England)
PHOF Profile
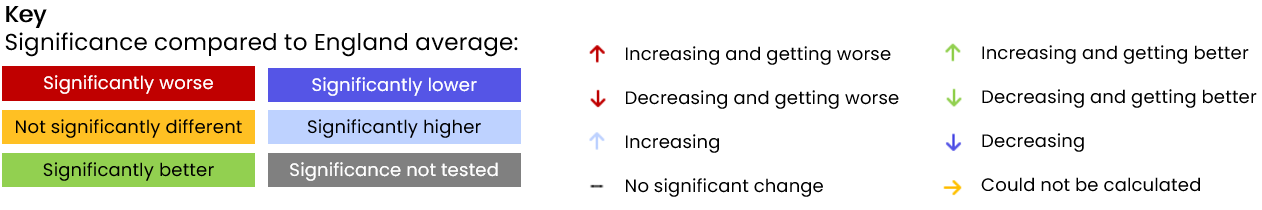
Notes:
- For indicators that aren’t straightforward to determine whether a high value is good or bad are shaded in blue rather than red/amber/green.
- Recent trend refers to analysis done by Fingertips which tests for a statistical trend. Please see the Fingertips tool for full details.
- Increases and decreases are only shown if they are statistically significant.
| A. Overarching indicators | ||||||||
|---|---|---|---|---|---|---|---|---|
| Indicator | Age | Sex | Period | Value | East Midlands region | England | Unit | Recent Trend |
| A01b - Life expectancy at birth | All ages | Male | 2023 | 78.6 | 78.9 | Inf | Years | |
| A01b - Life expectancy at birth | All ages | Male | 2021 - 23 | 78.2 | 78.8 | Inf | Years | |
| A01b - Life expectancy at birth | All ages | Female | 2023 | 82.1 | 82.7 | Inf | Years | |
| A01b - Life expectancy at birth | All ages | Female | 2021 - 23 | 81.8 | 82.6 | Inf | Years | |
| A02a - Inequality in life expectancy at birth | All ages | Male | 2021 - 23 | 8.9 | 10.1 | 10.5 | Years | |
| A02a - Inequality in life expectancy at birth | All ages | Female | 2021 - 23 | 6.9 | 7.9 | 8.3 | Years | |
| A01b - Life expectancy at 65 | 65 | Male | 2023 | 17.9 | 18.6 | 18.8 | Years | |
| A01b - Life expectancy at 65 | 65 | Male | 2021 - 23 | 18.0 | 18.5 | 18.7 | Years | |
| A01b - Life expectancy at 65 | 65 | Female | 2023 | 20.5 | 20.9 | 21.3 | Years | |
| A01b - Life expectancy at 65 | 65 | Female | 2021 - 23 | 20.3 | 20.8 | 21.1 | Years | |
| A02a - Inequality in life expectancy at 65 | 65 | Male | 2021 - 23 | 4.6 | 5.3 | 5.6 | Years | |
| A02a - Inequality in life expectancy at 65 | 65 | Female | 2021 - 23 | 3.7 | 4.8 | 5.0 | Years | |
| Source: OHID Fingertips | ||||||||
| B. Wider Determinants of Health | ||||||||
|---|---|---|---|---|---|---|---|---|
| Indicator | Age | Sex | Period | Value | East Midlands region | England | Unit | Recent Trend |
| B01b - Children in absolute low income families (under 16s) | <16 yrs | Persons | 2023/24 | 17.5 | 20.7 | 19.1 | % | |
| B01b - Children in relative low income families (under 16s) | <16 yrs | Persons | 2023/24 | 20.8 | 24.1 | 22.1 | % | |
| B03 - Pupil absence | 5-15 yrs | Persons | 2023/24 | 7.4 | 7.1 | 7.1 | % | |
| B08d - Percentage of people in employment | 16-64 yrs | Persons | 2023/24 | 82.9 | 75.4 | 75.7 | % | |
| B09a - Sickness absence: the percentage of employees who had at least one day off in the previous week | 16+ yrs | Persons | 2021 - 23 | 2.7 | 2.1 | 2.2 | % | |
| B09b - Sickness absence: the percentage of working days lost due to sickness absence | 16+ yrs | Persons | 2021 - 23 | 2.0 | 1.3 | 1.2 | % | |
| B12a - Violent crime - hospital admissions for violence (including sexual violence) | All ages | Persons | 2021/22 - 23/24 | 47.7 | 28.8 | 34.2 | per 100,000 | |
| B12b - Violent crime - violence offences per 1,000 population | All ages | Persons | 2023/24 | 34.7 | 31.7 | 32.7 | per 1,000 | |
| B12c - Violent crime - sexual offences per 1,000 population | All ages | Persons | 2023/24 | 2.8 | 3.0 | 2.9 | per 1,000 | |
| B13a - Reoffending levels: percentage of offenders who reoffend | All ages | Persons | 2022/23 | 26.1 | 27.6 | 26.2 | % | |
| B13b - Reoffending levels: average number of reoffences per reoffender | All ages | Persons | 2022/23 | 4.0 | 4.2 | 4.0 | per re-offender | |
| B14a - The rate of complaints about noise | All ages | Persons | 2023/24 | 1.9 | 5.3 | 5.9 | per 1,000 | |
| B14b - The percentage of the population exposed to road, rail and air transport noise of 65dB(A) or more, during the daytime | All ages | Persons | 2021 | 2.8 | 3.0 | 4.3 | % | |
| B14c - The percentage of the population exposed to road, rail and air transport noise of 55 dB(A) or more during the night-time | All ages | Persons | 2021 | 7.2 | 6.2 | 8.4 | % | |
| B15a - Homelessness: households owed a duty under the Homelessness Reduction Act | Not applicable | Not applicable | 2023/24 | NA | 11.2 | 13.4 | per 1,000 | |
| B15c - Homelessness: households in temporary accommodation | Not applicable | Not applicable | 2023/24 | NA | 1.6 | 4.6 | per 1,000 | |
| B17 - Fuel poverty (low income, low energy efficiency methodology) | Not applicable | Not applicable | 2023 | 11.7 | 11.7 | 11.4 | % | |
| 1.01i - Children in low income families (all dependent children under 20) | 0-19 yrs | Persons | 2016 | 16.7 | 16.3 | 17.0 | % | |
| Source: OHID Fingertips | ||||||||
| C. Health Improvement | ||||||||
|---|---|---|---|---|---|---|---|---|
| Indicator | Age | Sex | Period | Value | East Midlands region | England | Unit | Recent Trend |
| C01 - Total prescribed LARC excluding injections rate / 1,000 | All ages | Female | 2023 | 54.5 | 45.7 | 43.5 | per 1,000 | |
| C04 - Low birth weight of term babies | >=37 weeks gestational age at birth | Persons | 2022 | 2.9 | 2.6 | 2.9 | % | |
| C06 - Smoking status at time of delivery | All ages | Female | 2023/24 | 8.9 | 9.9 | 7.4 | % | |
| C09a - Reception prevalence of overweight (including obesity) | 4-5 yrs | Persons | 2023/24 | 22.1 | 22.0 | 22.1 | % | |
| C09b - Year 6 prevalence of overweight (including obesity) | 10-11 yrs | Persons | 2023/24 | 32.5 | 36.0 | 35.8 | % | |
| C10 - Percentage of physically active children and young people | 5-16 yrs | Persons | 2023/24 | 55.3 | 45.7 | 47.8 | % | |
| C11a - Hospital admissions caused by unintentional and deliberate injuries in children (aged 0 to 14 years) | <15 yrs | Persons | 2023/24 | 44.3 | 54.9 | 72.7 | per 10,000 | |
| C11a - Hospital admissions caused by unintentional and deliberate injuries in children (aged 0 to 4 years) | 0-4 yrs | Persons | 2023/24 | 65.9 | 68.3 | 93.2 | per 10,000 | |
| C11b - Hospital admissions caused by unintentional and deliberate injuries in young people (aged 15 to 24 years) | 15-24 yrs | Persons | 2023/24 | 96.1 | 79.2 | 88.6 | per 10,000 | |
| C14b - Emergency Hospital Admissions for Intentional Self-Harm | All ages | Persons | 2023/24 | 108.0 | 128.1 | 117.0 | per 100,000 | |
| C15 - Percentage of adults meeting the '5-a-day' fruit and vegetable consumption recommendations (new method) | 16+ yrs | Persons | 2023/24 | 34.7 | 30.1 | 31.3 | % | |
| C15 - Proportion of the population meeting the recommended '5 a day' on a 'usual day' (adults) (old method) | 16+ yrs | Persons | 2019/20 | 57.0 | 55.0 | 55.4 | % | |
| C16 - Overweight (including obesity) prevalence in adults, (using adjusted self-reported height and weight) | 18+ yrs | Persons | 2023/24 | 65.6 | 67.1 | 64.5 | % | |
| C17a - Percentage of physically active adults | 19+ yrs | Persons | 2023/24 | 67.0 | 66.7 | 67.4 | % | |
| C17b - Percentage of physically inactive adults | 19+ yrs | Persons | 2023/24 | 21.7 | 22.7 | 22.0 | % | |
| C18 - Smoking Prevalence in adults (aged 18 and over) - current smokers (APS) | 18+ yrs | Persons | 2023 | 10.7 | 12.5 | 11.6 | % | |
| C19d - Deaths from drug misuse | All ages | Persons | 2021 - 23 | 6.3 | 5.4 | 5.5 | per 100,000 | |
| C21 - Admission episodes for alcohol-related conditions (Narrow) | All ages | Persons | 2023/24 | 673.1 | 553.6 | 504.1 | per 100,000 | |
| C21 - Admission episodes for alcohol-related conditions (Narrow) | All ages | Male | 2023/24 | 884.6 | 724.9 | 686.5 | per 100,000 | |
| C21 - Admission episodes for alcohol-related conditions (Narrow) | All ages | Female | 2023/24 | 478.6 | 396.8 | 339.5 | per 100,000 | |
| C22 - Estimated diabetes diagnosis rate | 17+ yrs | Persons | 2018 | 81.4 | 84.6 | 78.0 | % | |
| C23 - Percentage of cancers diagnosed at stages 1 and 2 | All ages | Persons | 2021 | 54.0 | 52.9 | 54.4 | % | |
| C24a - Cancer screening coverage: breast cancer | 53-70 yrs | Female | 2024 | 76.6 | 71.2 | 69.9 | % | |
| C24b - Cancer screening coverage: cervical cancer (aged 25 to 49 years old) | 25-49 yrs | Female | 2024 | 76.9 | 68.2 | 66.1 | % | |
| C24c - Cancer screening coverage: cervical cancer (aged 50 to 64 years old) | 50-64 yrs | Female | 2024 | 78.7 | 75.8 | 74.3 | % | |
| C24d - Cancer screening coverage: bowel cancer | 60-74 yrs | Persons | 2024 | 74.6 | 72.9 | 71.8 | % | |
| C24e - Abdominal Aortic Aneurysm Screening Coverage | 65 | Male | 2023/24 | 88.3 | 86.2 | 81.9 | % | |
| C27 - Percentage reporting a long-term Musculoskeletal (MSK) problem | 16+ yrs | Persons | 2023 | 20.0 | 20.0 | 18.4 | % | |
| C28a - Self reported wellbeing: people with a low satisfaction score | 16+ yrs | Persons | 2022/23 | 6.0 | 6.5 | 5.6 | % | |
| C28b - Self reported wellbeing: people with a low worthwhile score | 16+ yrs | Persons | 2022/23 | 7.1 | 4.4 | 4.4 | % | |
| C28c - Self reported wellbeing: people with a low happiness score | 16+ yrs | Persons | 2022/23 | 9.0 | 9.3 | 8.8 | % | |
| C28d - Self reported wellbeing: people with a high anxiety score | 16+ yrs | Persons | 2022/23 | 23.4 | 21.5 | 23.3 | % | |
| C29 - Emergency hospital admissions due to falls in people aged 65 and over | 65+ yrs | Persons | 2023/24 | 2,245.8 | 1,908.5 | 1,984.0 | per 100,000 | |
| C29 - Emergency hospital admissions due to falls in people aged 65 to 79 | 65-79 yrs | Persons | 2023/24 | 1,039.7 | 908.4 | 954.7 | per 100,000 | |
| C29 - Emergency hospital admissions due to falls in people aged 80 plus | 80+ yrs | Persons | 2023/24 | 5,743.5 | 4,808.6 | 4,968.9 | per 100,000 | |
| Source: OHID Fingertips | ||||||||
| D. Health Protection | ||||||||
|---|---|---|---|---|---|---|---|---|
| Indicator | Age | Sex | Period | Value | East Midlands region | England | Unit | Recent Trend |
| D01 - Air pollution: estimated fraction of mortality attributable to particulate air pollution | 30+ yrs | Persons | 2023 | 5.9 | 5.6 | 5.2 | % | |
| D02a - Chlamydia detection rate per 100,000 aged 15 to 24 years | 15-24 yrs | Male | 2024 | 970.9 | 908.7 | 837.2 | per 100,000 | |
| D02a - Chlamydia detection rate per 100,000 aged 15 to 24 years | 15-24 yrs | Female | 2024 | 2,139.3 | 1,775.4 | 1,589.4 | per 100,000 | |
| D02a - Chlamydia detection rate per 100,000 aged 15 to 24 years | 15-24 yrs | Persons | 2024 | 1,529.3 | 1,351.5 | 1,249.8 | per 100,000 | |
| D02b - New STI diagnoses (excluding chlamydia aged 24 and under) per 100,000 | All ages | Persons | 2024 | 296.0 | 313.5 | 482.3 | per 100,000 | |
| D07 - HIV late diagnosis in people first diagnosed with HIV in the UK | 15+ yrs | Persons | 2021 - 23 | 0.0 | 47.5 | 43.5 | % | |
| D08a - Proportion of drug sensitive TB notifications who had completed a full course of treatment by 12 months | All ages | Persons | 2022 | NA | 76.5 | 82.8 | % | |
| D08b - TB incidence (three year average) | All ages | Persons | 2021 - 23 | 3.2 | 7.7 | 8.0 | per 100,000 | |
| D10 - Adjusted antibiotic prescribing in primary care by the NHS | All ages | Persons | 2023 | 0.7 | 0.9 | 0.9 | per STAR-PU | |
| Source: OHID Fingertips | ||||||||
| E. Healthcare and Premature Mortality | ||||||||
|---|---|---|---|---|---|---|---|---|
| Indicator | Age | Sex | Period | Value | East Midlands region | England | Unit | Recent Trend |
| E01 - Infant mortality rate | <1 yr | Persons | 2021 - 23 | 4.6 | 4.4 | 4.1 | per 1,000 | |
| E02 - Percentage of 5 year olds with experience of visually obvious dental decay | 5 yrs | Persons | 2023/24 | 21.8 | 21.5 | 22.4 | % | |
| E03 - Under 75 mortality rate from causes considered preventable | <75 yrs | Persons | 2023 | 159.2 | 161.7 | 153.0 | per 100,000 | |
| E03 - Under 75 mortality rate from causes considered preventable | <75 yrs | Persons | 2021 - 23 | 177.3 | 170.1 | 163.7 | per 100,000 | |
| E04a - Under 75 mortality rate from cardiovascular disease | <75 yrs | Persons | 2023 | 75.3 | 80.3 | 77.4 | per 100,000 | |
| E04a - Under 75 mortality rate from cardiovascular disease | <75 yrs | Persons | 2021 - 23 | 79.9 | 80.6 | 77.1 | per 100,000 | |
| E04b - Under 75 mortality rate from cardiovascular disease considered preventable | <75 yrs | Persons | 2021 - 23 | 32.1 | 32.5 | 30.5 | per 100,000 | |
| E05a - Under 75 mortality rate from cancer | <75 yrs | Persons | 2023 | 136.5 | 126.4 | 120.8 | per 100,000 | |
| E05a - Under 75 mortality rate from cancer | <75 yrs | Persons | 2021 - 23 | 128.4 | 125.9 | 121.6 | per 100,000 | |
| E05b - Under 75 mortality rate from cancer considered preventable | <75 yrs | Persons | 2021 - 23 | 51.0 | 50.5 | 49.5 | per 100,000 | |
| E06a - Under 75 mortality rate from liver disease | <75 yrs | Persons | 2023 | 25.0 | 23.6 | 21.9 | per 100,000 | |
| E06a - Under 75 mortality rate from liver disease | <75 yrs | Persons | 2021 - 23 | 25.8 | 22.4 | 21.5 | per 100,000 | |
| E06b - Under 75 mortality rate from liver disease considered preventable | <75 yrs | Persons | 2021 - 23 | 22.6 | 20.2 | 19.2 | per 100,000 | |
| E07a - Under 75 mortality rate from respiratory disease | <75 yrs | Persons | 2023 | 32.2 | 33.2 | 33.7 | per 100,000 | |
| E07a - Under 75 mortality rate from respiratory disease | <75 yrs | Persons | 2021 - 23 | 27.0 | 29.4 | 30.3 | per 100,000 | |
| E07b - Under 75 mortality rate from respiratory disease considered preventable | <75 yrs | Persons | 2021 - 23 | 18.1 | 17.8 | 18.0 | per 100,000 | |
| E08 - Mortality rate from a range of specified communicable diseases, including influenza | All ages | Persons | 2021 - 23 | 13.2 | 12.1 | 13.0 | per 100,000 | |
| E10 - Suicide rate | 10+ yrs | Persons | 2021 - 23 | 13.8 | 11.3 | 10.7 | per 100,000 | |
| E11 - Emergency readmissions within 30 days of discharge from hospital | All ages | Persons | 2023/24 | 16.1 | 14.8 | 14.8 | % | |
| E13 - Hip fractures in people aged 65 and over | 65+ yrs | Persons | 2023/24 | 504.1 | 556.0 | 547.1 | per 100,000 | |
| E13 - Hip fractures in people aged 65 to 79 | 65-79 yrs | Persons | 2023/24 | 206.5 | 240.7 | 237.8 | per 100,000 | |
| E13 - Hip fractures in people aged 80 and over | 80+ yrs | Persons | 2023/24 | 1,367.4 | 1,470.3 | 1,443.8 | per 100,000 | |
| E14 - Winter mortality index | All ages | Persons | Aug 2021 - Jul 2022 | −1.8 | 6.5 | 8.1 | % | |
| E14 - Winter mortality index (age 85 plus) | 85+ yrs | Persons | Aug 2021 - Jul 2022 | −2.7 | 8.5 | 11.3 | % | |
| E15 - Estimated dementia diagnosis rate (aged 65 and older) | 65+ yrs | Persons | 2025 | 76.2 | 67.8 | 65.6 | per 100 | |
| Source: OHID Fingertips | ||||||||
Prevalence Maps of Derbyshire
The maps below illustrate various geographies for Derbyshire. LSOAs and MSOAs are geographical divisions used for statistical purposes, allowing for more detailed analysis of local data. In these maps, you can explore various health indicators and data for Derbyshire, providing valuable insights into the area’s health and wellbeing.
 |
In the top right of the map, you’ll find the ‘Layer Control’ icon. This is an easy way to customise what you see on the map visualisation. Click the ‘Layer Control’ to choose which information is displayed on the map. Pick the indicator that interests you the most, and the map will transform accordingly. |
 Further Analysis & Assessments
Derbyshire Joint Strategic Needs Assessment (JSNA) involves a thorough examination of a specific health problem, exploring its causes, consequences, and underlying factors. It combines various data sources, collaboration with stakeholders, and rigorous analysis to generate insights for evidence-informed interventions and policy changes.
 More Information & Resources
Contributors
Carmel Chaplain, Public Health Lead