Environment means many things. It relates to issues such as climate change and waste, but also to the lived environment.
The amount of Electric Vehicle charging points is rising in both Derbyshire (66.1 per 100,000) and England (115.4 per 100,000) in 2025 Q1, with growth since 2020 higher in Derbyshire than in England.
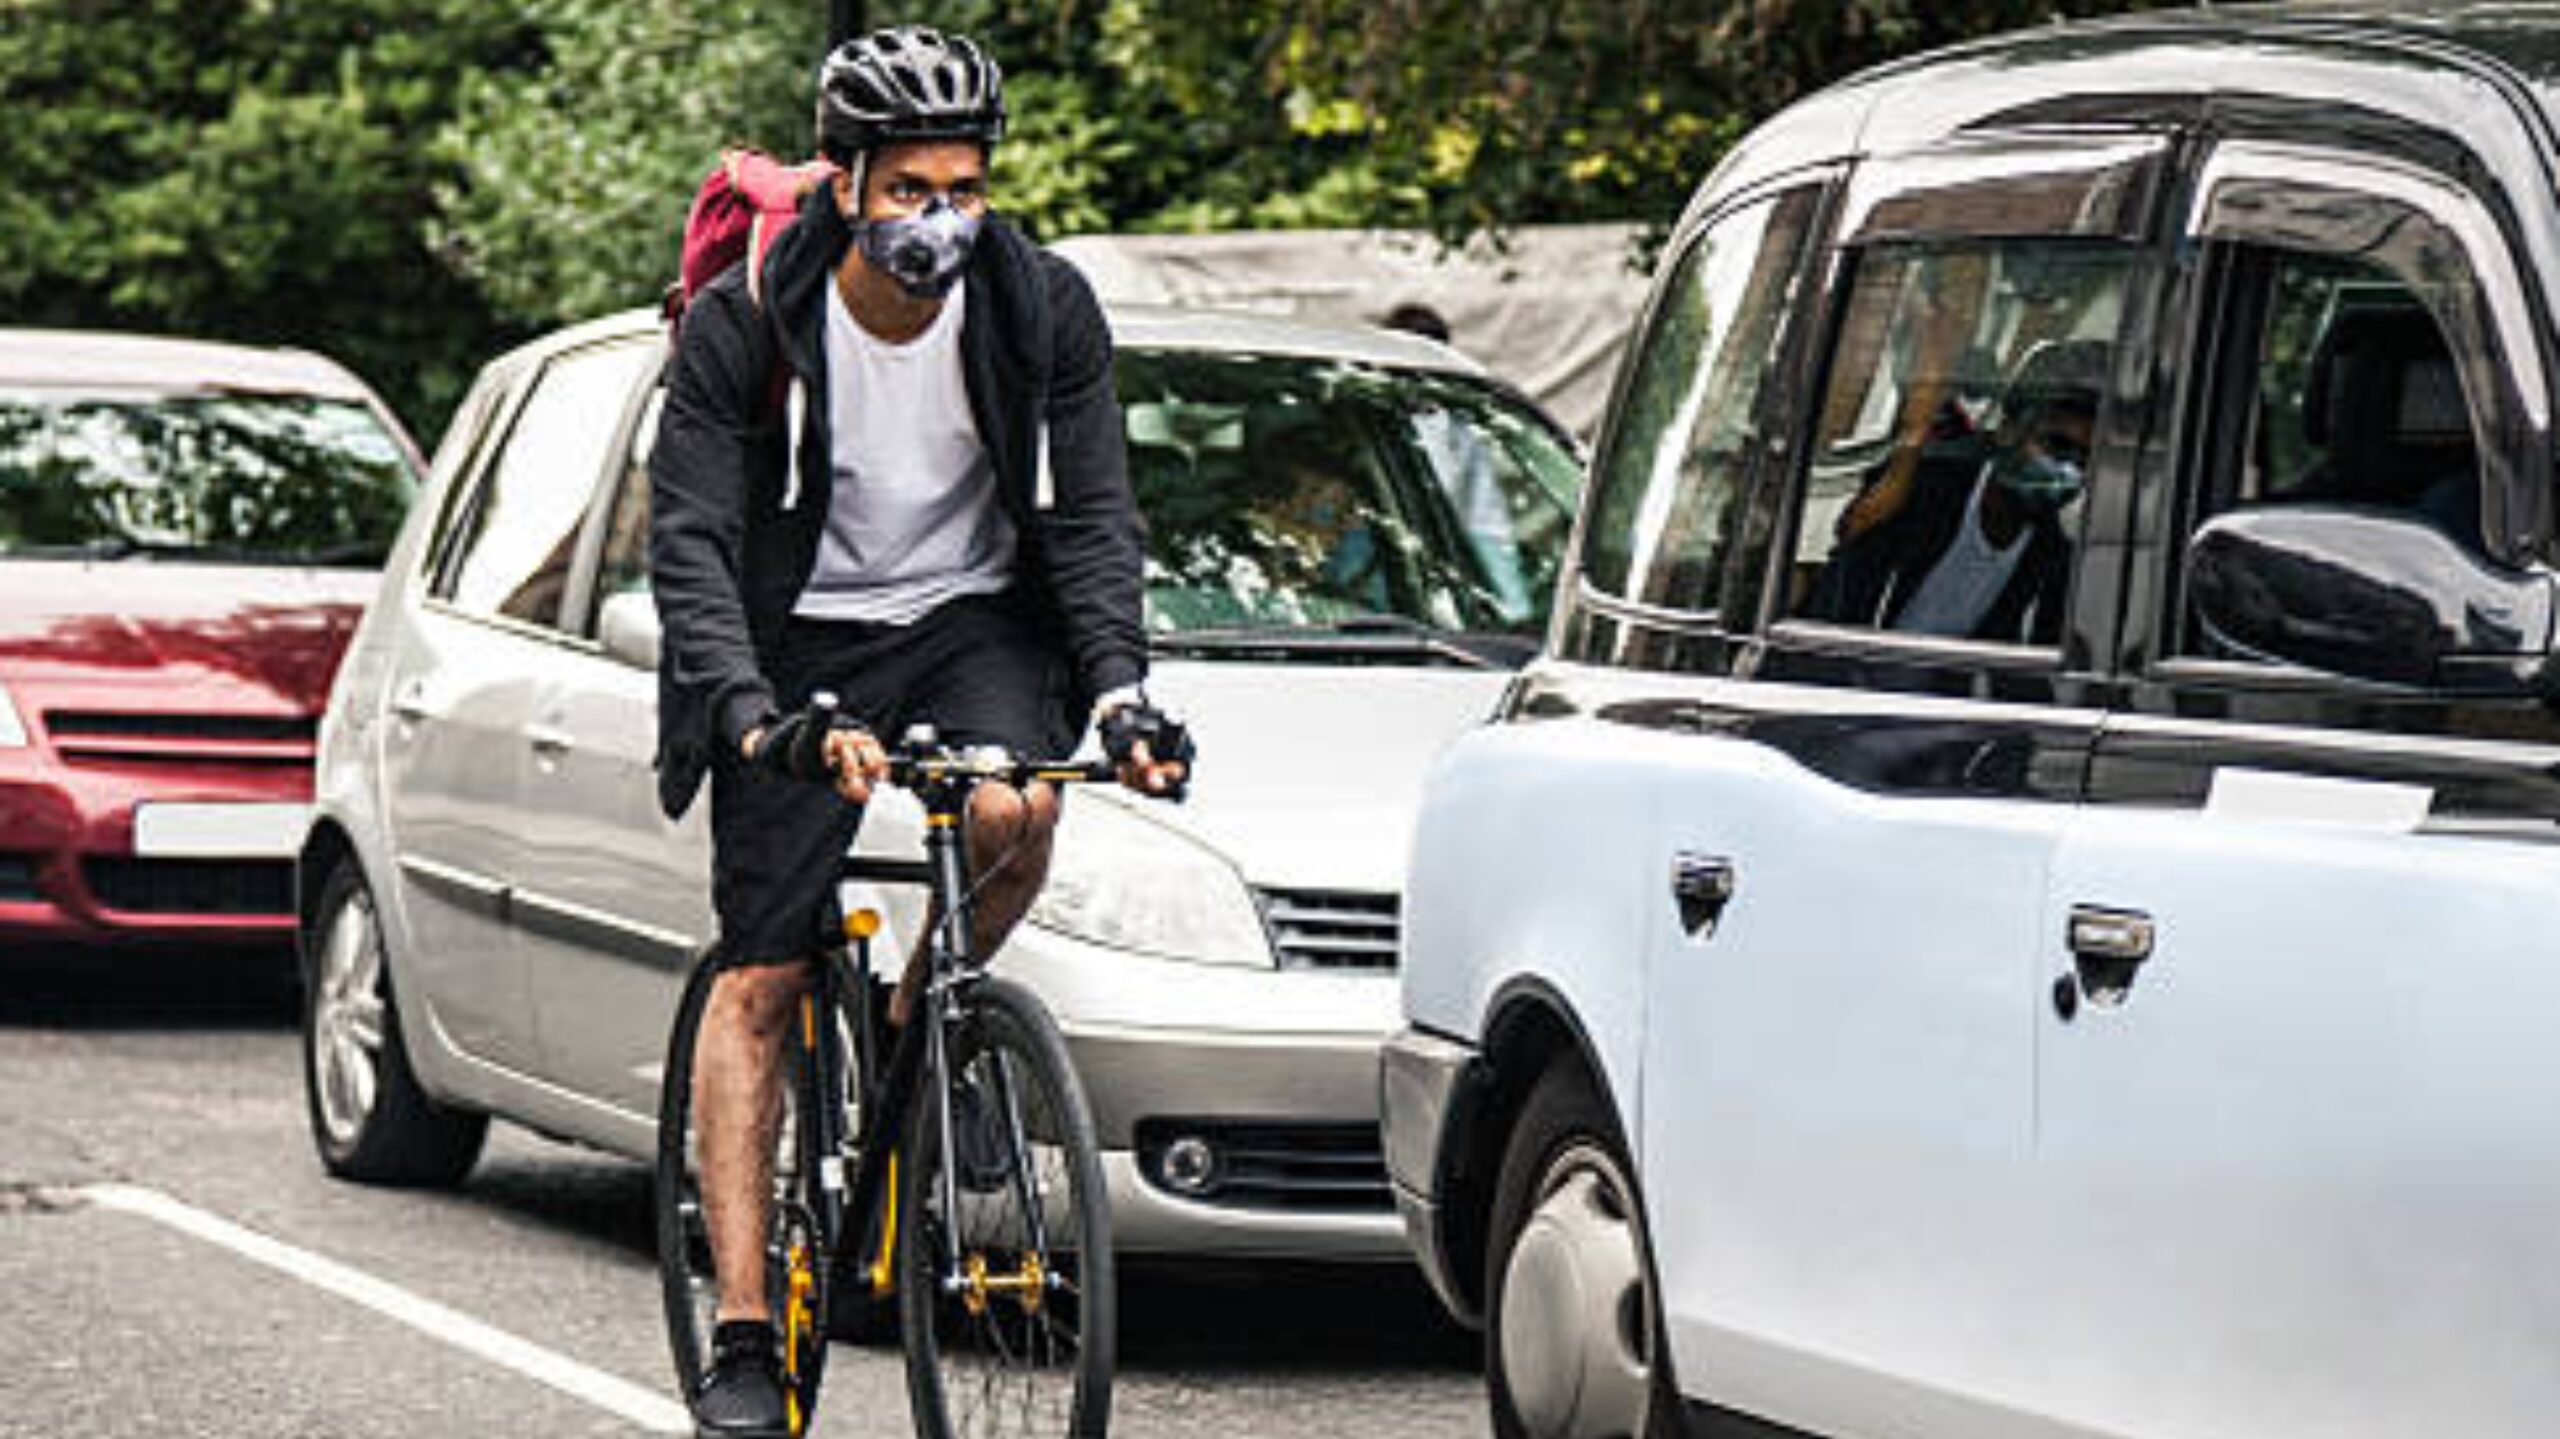
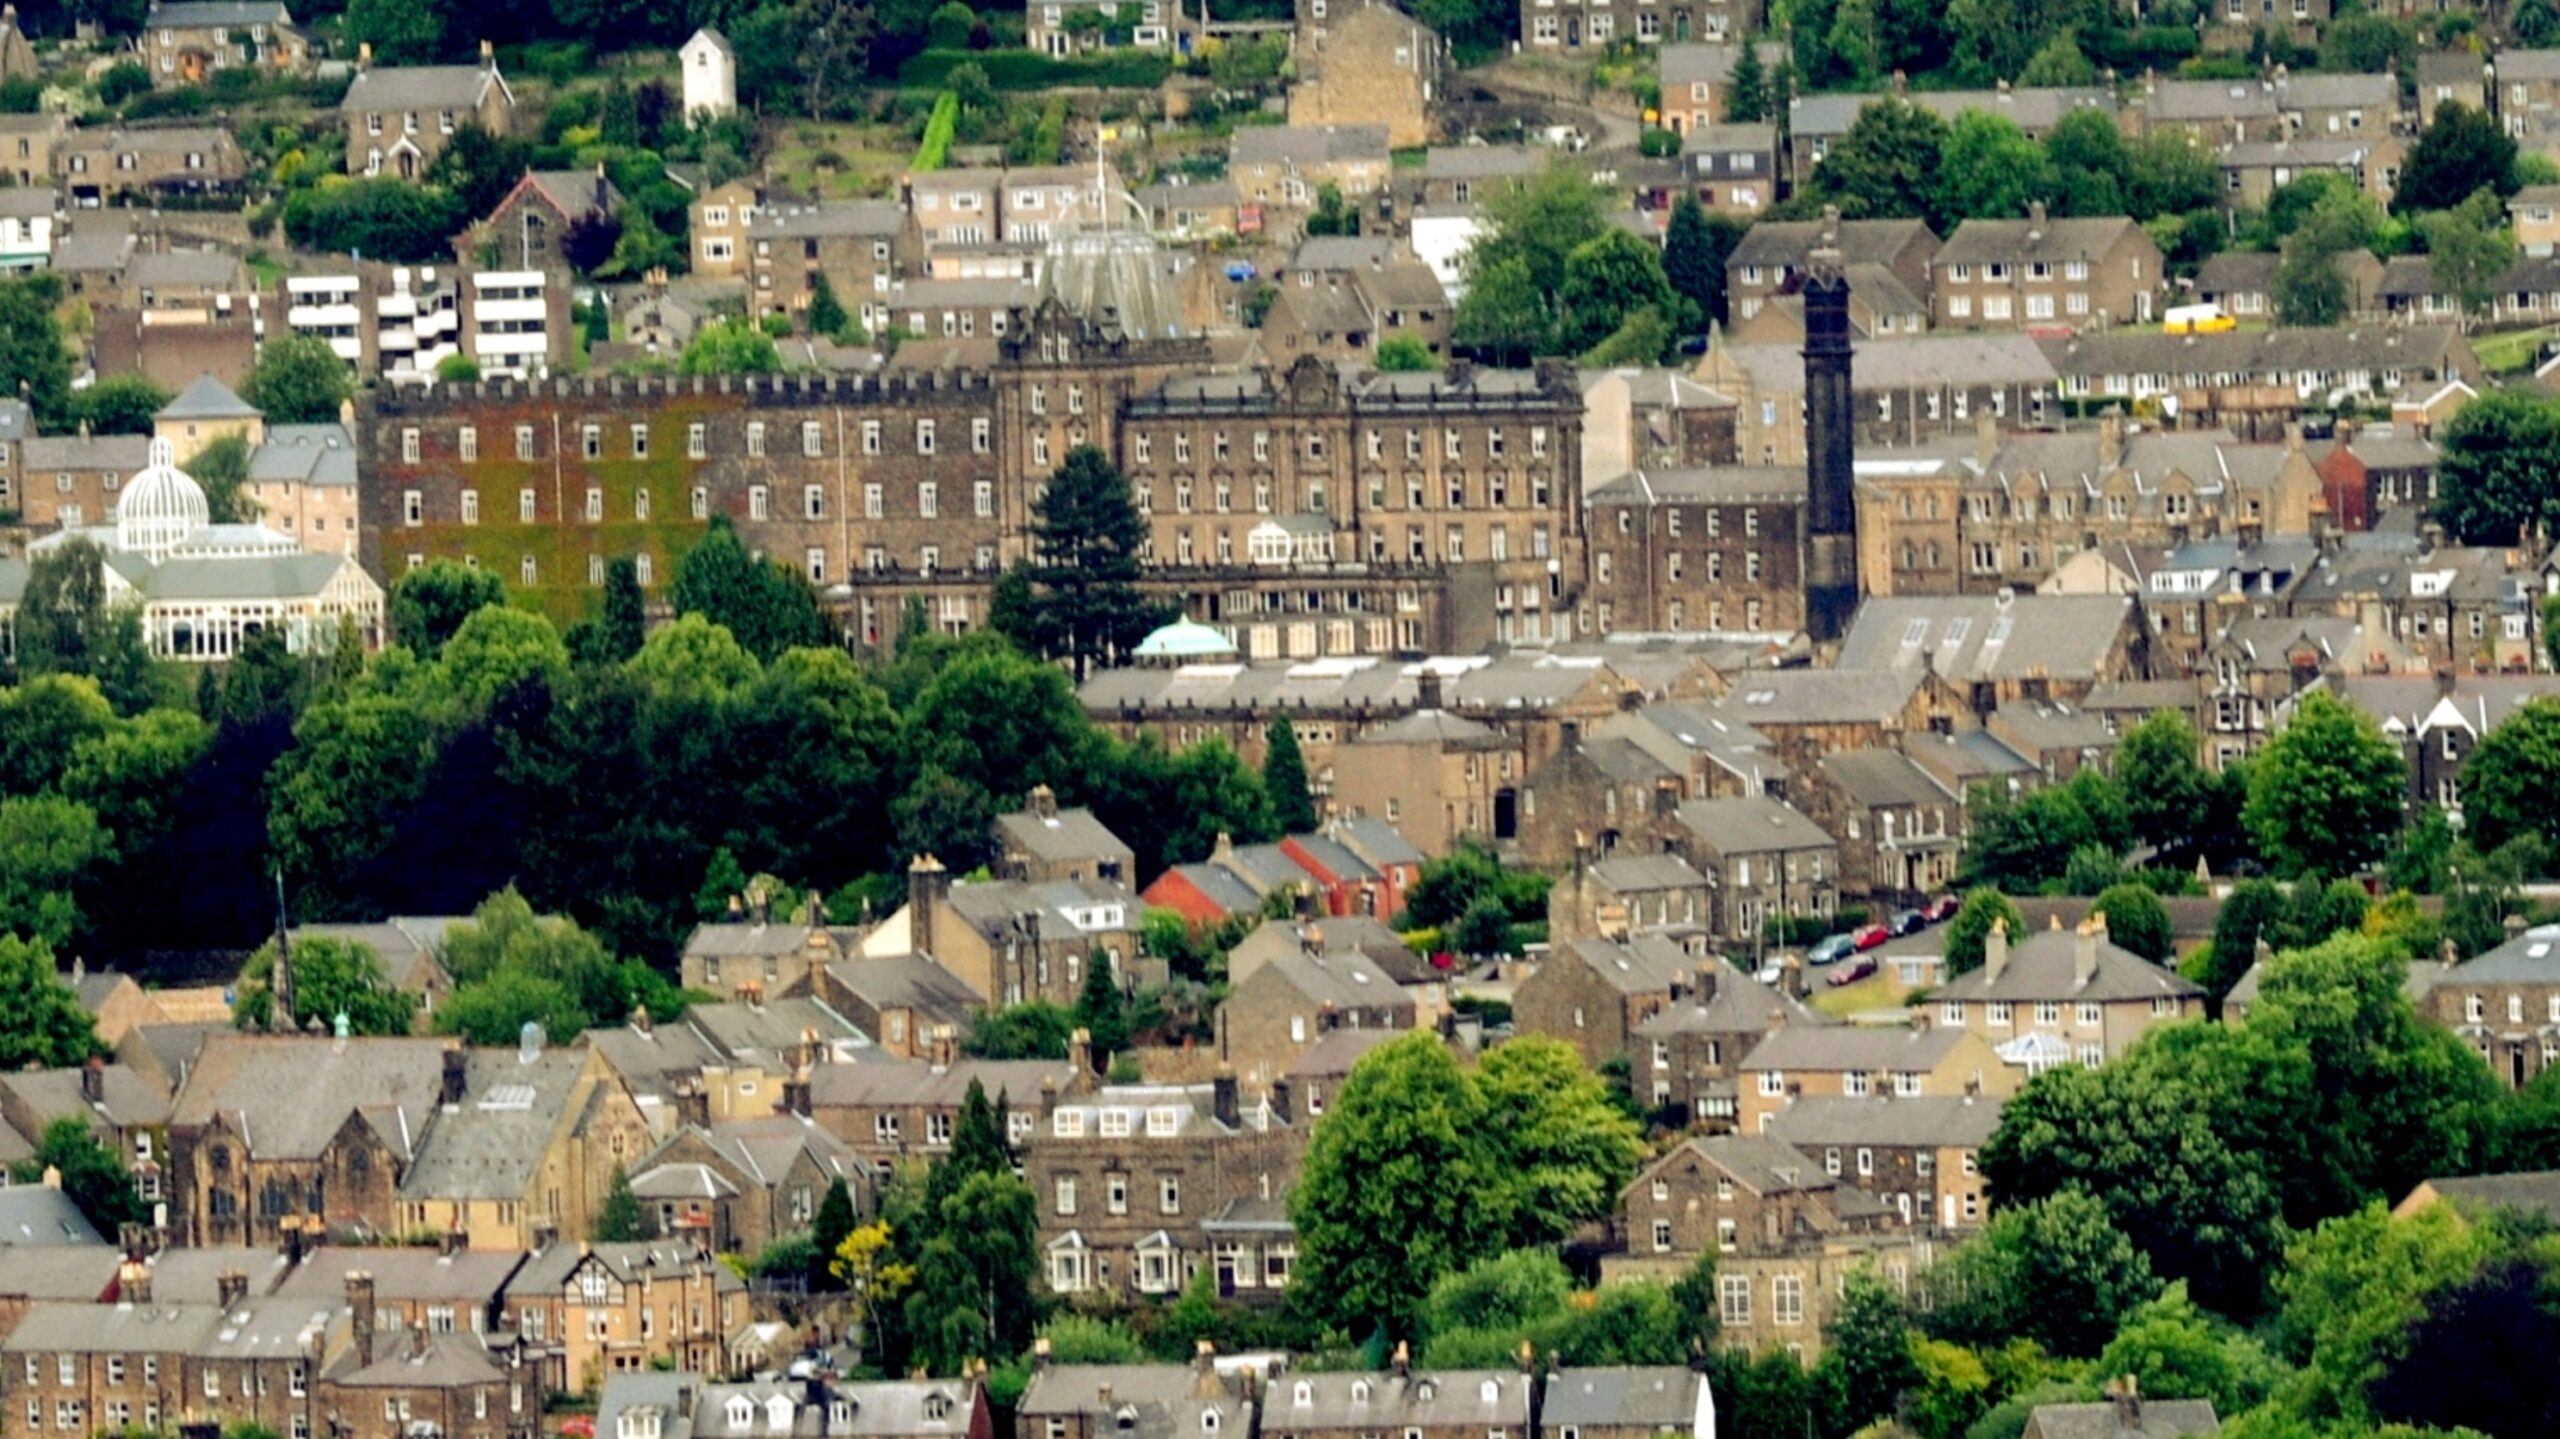
The lived environment within Derbyshire is heavily impacted how connected people are and how easy it is to travel. The Transport Connectivity Metric shows that Derbyshire is worse connected than England, with the county scoring 57.2 out of 100 compared to England’s score 64.5. Usually, the more rural a place the lower its connectivity score, so large swathes of the Derbyshire Dales and High Peak score within the lower decile of England’s LSOAs.
Interactive Maps and Charts

Environment
Data related to the environment in Derbyshire, including CO2 per capita and km2, waste and recycling, and EV charging points
Connectivity
Data related to the ease with which people can access services via different methods of travel
Connectivity Score – what does it mean for Derbyshire?
A detailed look at the Department for Transports Connectivity Score detailing how well connected different areas in Derbyshire are using a range of transport methods and to a range of locations.
Documents
Derbyshire’s Greenhouse Gas Emissions Report 2022 to 2023
Derbyshire’s Greenhouse Gas Emissions Report 2021 to 2022
Derbyshire’s Greenhouse Gas Emissions Report 2020 to 2021
Derbyshire’s Greenhouse Gas Emissions Report 2019 to 2020
Derbyshire’s Greenhouse Gas Emissions Report 2018 to 2019
Derbyshire’s Heat Mapping and Energy Masterplanning AECOM, part 1
Derbyshire’s Heat Mapping and Energy Masterplanning AECOM, part 2
Derbyshire’s Waste Strategy – 2013 to 2026
Local Flood Risk Management Strategy
Links
Derbyshire County Council – Environment
Derbyshire County Council – Climate Change
Climate Change Committee
Environment Agency
Transport Connectivity Metric