

What are the population estimates?
The Office for National Statistics (ONS) publish the mid-year population estimates (MYE) on an annual basis. These estimates provide figures on the ‘usual population’ in an area by age and sex. They are available at a range of geographical levels from the United Kingdom down to Output Areas (small areas of around 100 to 625 people, used for Census analysis).
The ‘usual population’ refers to those who actually live in an area, regardless of nationality. Arriving international migrants are included only if they remain in the UK for at least a year and emigrants are excluded if they remain outside of the UK for a year. Members of the armed forces stationed outside of the UK are excluded and students are taken to be a usual resident at their term time address.
As well as a count of the population, the mid-year estimates also measure population change since the previous year, with change broken down into different components. The main components of change include natural change (births and deaths), internal migration (people moving within the UK) and international migration (people moving to and from countries outside of the UK).
Estimates are presented unrounded to encourage analysis, but this should not be taken as an indication of accuracy. More information on the accuracy of estimates is available in the methodology document.
Key findings
Derbyshire is growing, but more slowly than England. The county’s population has reached 822,377 in 2024, an increase of 5.9% over the last decade, which is below the national growth rate of 7.8%.
Both Derbyshire and England have a population which is 51% female and 49% male in 2024, with Derbyshire having seen a 0.2% swing from male to female bringing it level with England.
Derbyshire’s population profile is characterised by three things: an ageing population, consequently fewer working aged people, and a lower number of young people in the population.
It is ageing faster than England, with the proportion aged 65+ in the county increasing by 2.1 percentage points since 2014. England only saw a 1.2 point increase over the same period and Derbyshire now has 3.9% more older people than the national average
There are fewer children in Derbyshire than England. Over the past decade, Derbyshire’s population aged 0-15 fell from 17.3% to 16.7%, a 0.6 percentage point drop—slightly more than England’s 0.5 point decrease. Derbyshire’s proportion of population in this age group is now 1.7 points below the national average.
There are also fewer working-aged people in Derbyshire than England, with the county seeing a faster decline in its working aged population (aged 16-64) than nationally. Since 2014 Derbyshire’s working aged population has declined by 1.5 percentage points, while England has seen a decile of 0.8 points, putting Derbyshire 2.2% below the national average.
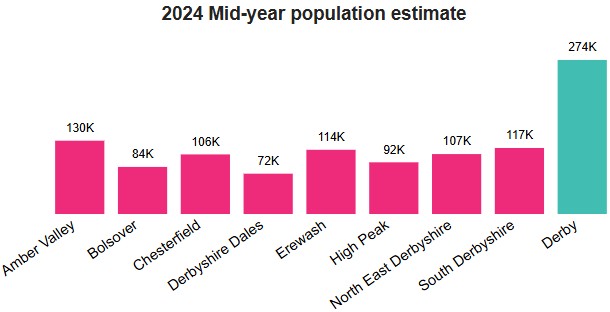
Amber Valley (130,451) has the largest population in Derbyshire, while Derbyshire Dales (71,757) has the smallest.
South Derbyshire (117,493) has the second largest population in the county while Erewash (114,253) has the third largest.
North East Derbyshire (106,646) is the fourth largest district by population, Chesterfield (106,054) the fifth and High Peak (91,959) the sixth.
Bolsover has the second smallest population in the county at 87,773.
Derby city is larger than any of the districts, with its own population of 274,149.
Growth within Derbyshire has varied over the past decade
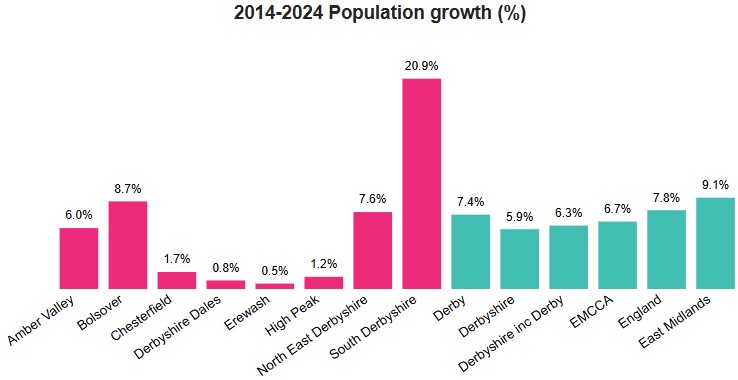
South Derbyshire has seen its population grow by 20.9% over the 10-year period, well above the national average. Bolsover (8.7%) has also grown more than England.
North East Derbyshire (7.6%) and Derby (7.4%) both had growth at around the national average.
Erewash (0.5%), Derbyshire Dales (0.8%), High Peak (1.2%) and Chesterfield (1.7%) all had growth at well below the national average, while Amber Valley (6.0%) was also a little below England’s growth.
Population by age and gender
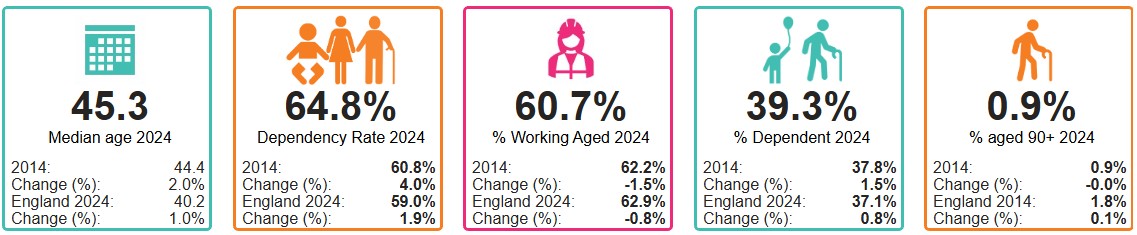
- Derbyshire has an older population than England, with the gap in median age having grown since 2014. Derbyshire’s median age increased from 44.4 to 45.3 (+0.9%) over the 10-year period while England’s increased from 38.8 to 40.2 (+0.4%).
- The county’s dependency ratio (the number of individuals aged 0-15 and 65+ per working aged population) stood at 60.8% in 2014 and has increased by 4%. This increase is much larger than England’s (1.9%), with England’s dependency ratio (59.0%) now well below Derbyshire’s (64.8%).Both Derbyshire (-1.5%) and England (-0.8%) have seen a decline in the proportion of their populations working aged (16-64), with Derbyshire (60.7%) a little below the national average (62.9%) in 2024.As well as a decline in the working aged population, both Derbyshire (-0.6%) and England (-0.5%) have also seen their child populations (aged 0-15) decrease over the past ten years. Derbyshire (16.7%) is again someway below England (18.4%) in this age group.
Derbyshire has seen a very small decrease in the proportion of its population aged 90+ since 2014, with the proportion remaining 0.9%. England saw a slight increase (0.1%), with 1.8% of the national population aged 90+ in 2024.
This is the opposite of the trend for older people (aged 65+) where Derbyshire (22.6%) has a higher proportion than England (18.7%) in 2024 and has seen a higher increase over the last ten years (2.1% for Derbyshire, 1.2% for England).
Population pyramid
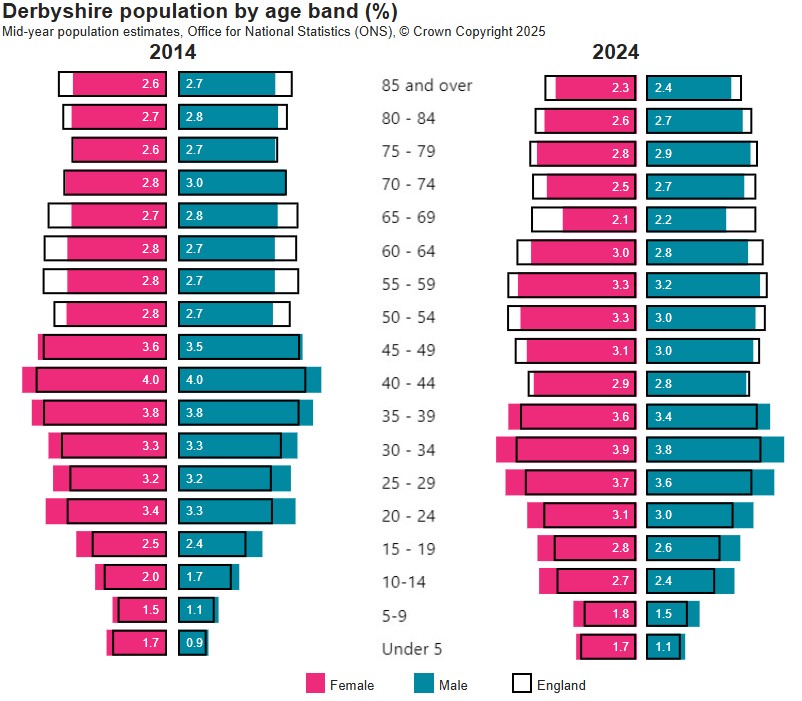
- In 2024 Derbyshire has a smaller proportion of its population than England in every age band aged 49 and under, but larger proportions aged 50+. 55.6% of Derbyshire’s population is aged under 50, compared to 62.2% for England. 44.7% of the county population is aged 50+ while England has only 37.8% aged 50+.
- In 2014, the clear diving line between England and Derbyshire was younger, with Derbyshire (43.9%) having a smaller proportion in every band aged 0-39 than England (50.2%). Derbyshire (56.2%) then had a higher proportion in every age group 40+ than England (49.8%).Between 2014 and 2024 Derbyshire saw the biggest changes in the 45-49 bracket (decreased by 2.3%), 20-24 (decreased 1.2%), 75-79 (increased 1.4%) and 55-59 (increased 1.1%), with no clear trend. England also saw its biggest change in the 45-49 age bracket (-1.4%) but had no other age groups change by more than 1%.In 2024 Derbyshire has more males in every bracket aged 0-24, but more females in every bracket aged 25+. The differences are generally 0.1%, but widen in the older age groups, with there being 0.3% more females than males aged 75-84 and 0.6% more females than males aged 85+.
England follows a near identical trend to Derbyshire, with more males aged 0-24 and more females aged 25+, with the same gaps between males and females aged 75+.
Components of population change

- There are two main drivers of population change, natural change, (births and deaths) and migration, with migration broken down to internal (within the UK, including other English authorities), and international. This section looks at the impact of population change:
- Derbyshire’s population grew by 5.9% between 2014 and 2024, with this growth entirely driven by net migration of 70,921 people over the decade. The majority of this migration, 63,955 people (90.2%), came from withing the UK, while international migration accounted for just 6,966 people (9.8%).Natural change resulted in a net loss of 13,146 people over the last decade, with more deaths than births. In Derbyshire in 2014 there were 7,843 births, this has fallen to 6,593 in 2024. Deaths, however, have increased significantly over the same period, rising from 7,532 in 2024 to 8,995 in 2024.‘Other’ sources of change cause a total loss of 11,174 people over the decade, this largely relates to the movement of armed forces personnel and their families, plus ‘unattributable’ changes to the population.
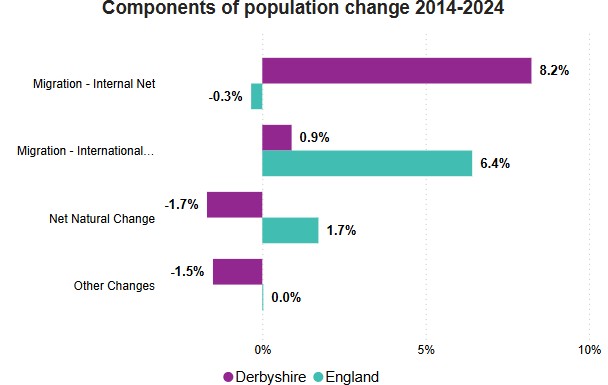
Internal migration is the biggest source of population growth in Derbyshire, with the population having increased by 8.4% since 2014 due to migration from the rest of the UK. England saw a 0.3% decrease in its 2014 population to other countries in the UK over the same decade.
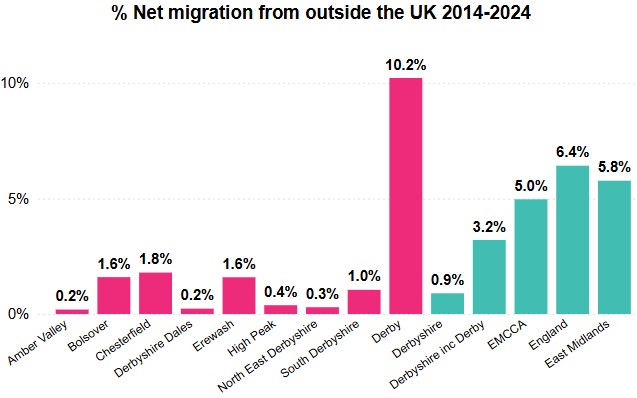
International migration has contributed only a 0.9% increase in Derbyshire’s population since 2014 while England saw a 6.4% increase from other countries.
Derbyshire lost 1.7% of its 2014 population to natural change, with more deaths than births over the last decade. England saw the opposite, with a 1.7% increase due to its higher birth rate, showing a clear difference in the age demographics between Derbyshire and England.
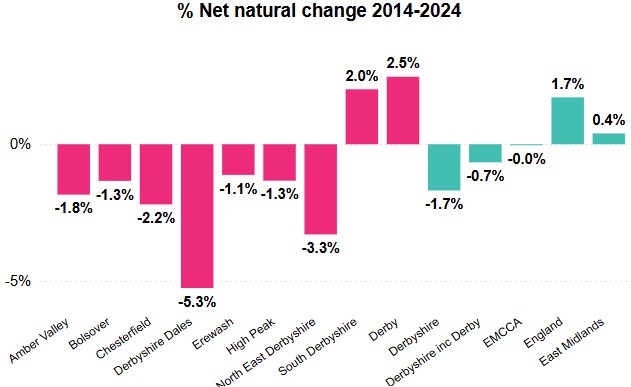
Only South Derbyshire (2%) saw population growth from natural change (more births than deaths) between 2014 and 2024.
Derbyshire Dales experienced the greatest decline from natural change between 2014 and 2024, with a 5.3% reduction through higher deaths than births.
Overall, Derbyshire’s natural population loss (-1.7%) was greater than both the East Midlands (+0.4%) and EMCCA (-0.03%), with the East Midlands gaining population through natural change.
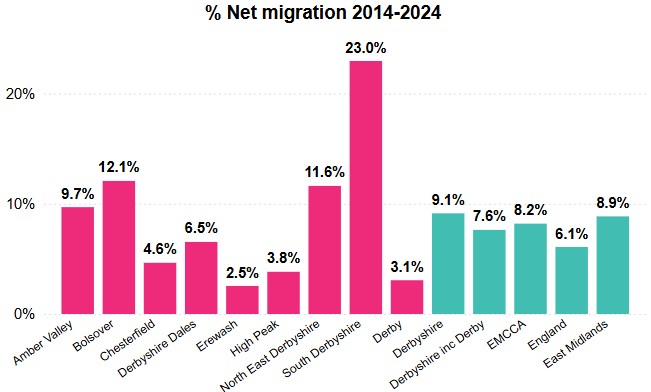
South Derbyshire saw the highest net migration, increasing its population by 23.0% over the period.
Bolsover (12.1%) and North East Derbyshire (11.6%) saw the next highest increases from net migration, with Amber Valley (9.7%) and Derbyshire Dales (6.5%) also seeing increases above the national average (6.1%).
Derbyshire’s net migration rate (9.1%) narrowly surpassed the East Midlands (8.9%) and EMCCA (8.2%).
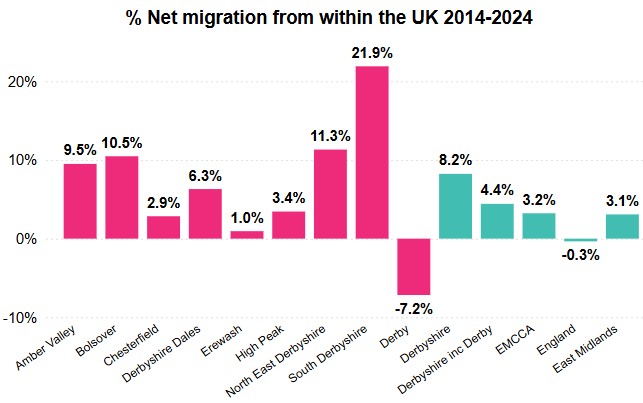
Between 2014 and 2024, all eight districts and boroughs gained population from elsewhere in the UK.
South Derbyshire saw the highest increase (21.9%) with North East Derbyshire (11.3%) and Bolsover (10.5%) next highest.
Neighbouring Derby lost 7.2% of its population to the rest of the UK
International migration remains low throughout Derbyshire.
Chesterfield had the highest increase in the county (1.8%), well below the national rate (6.4%).
Amber Valley and Derbyshire Dales (0.2%) both had the lowest population increase through international migration in Derbyshire,
Derby saw a higher rate of increase than the national average (10.2% v 6.4%).
Lower level trends
Electoral divisions
The divisions with the highest populations in 2024 are Hasland & Rother (15,525), Shirebrook & Pleasley (15,148) and Dronfield & Unstone (14,909). Hasland & Rother (15,896) was also the division with the highest population in 2014, followed by Dronfield & Unstone (15,049) and Long Eaton North (14,451).
Glossop North (10,077), Dovedale & Ashbourne North (10,261) and Breadsall & West Hallam (10,427) have the smallest populations. Etwall & Findern (6,584), Aston (6,682) and Glossop North (9,564) had the smallest populations in 2014.
The majority of divisions (43) have seen an increase in population since 2014, with Etwall & Findern (88%) having by far the greatest increase. Aston (65%) and Linton (23%) also had large increases, with all three divisions in South Derbyshire, where housing growth has been very high. Wingerworth & Shirland (22%) saw the highest growth outside of South Derbyshire, with this also driven by housing development.
Seventeen divisions saw a reduction in population over the last decade, with rural areas the most affected. Buxton North & East (-5%), Bakewell (-5%), Breadsall & West Hallam (-4%) and Breaston (-4%) lead the way in divisions with population decline.
Wards
Hilton (11,048), Aston (10,992) and Heanor West & Loscoe (10,519) have the highest populations of Derbyshire’s wards in 2024. Heanor West and Loscoe (10,503) and Hilton (9,906) were also in the top three in 2014, behind Belper East (10,571).
Barms (1,681), Temple (1,744) and Unstone (1,812) have the smallest populations in 2024. Brailsford (2,095), St John’s (1,898) and Ridgeway & Marsh Lane (1,818) had the smallest in 2014.
The majority of Derbyshire’s wards (99 of 158) saw a population increase over the last decade, with particular spikes in Willington & Findern (+77), Aston (+65%) and Etwall (+46%). Housing growth seems to be the main driver of population growth, with all of these wards in South Derbyshire. Linton (also in South Derbyshire) had the 4th highest growth (+35%) while Alport & South West Parishes (Amber Valley) ranks 5th with a 34% population growth, again driven by significant housing development.
Barms (-14%) and Buxton Central (-13%), both in High Peak, saw the greatest population decline over the last decade, with Bonsall & Winster (-11%) third. Derbyshire Dales and High Peak feature heavily in within the 59 wards to have seen a population decline, with 17 High Peak wards and 13 Derbyshire Dales wards losing population over the last decade. Every district saw at least two wards losing population, with the exception of South Derbyshire, where every ward gained population.
For more information, see the Population estimates, projections and components of change report on the Derbyshire Observatory.
What does this mean for Derbyshire?
While population growth across the Derbyshire is slower than England, rapid population growth in areas like South Derbyshire, linked to increased housing, will create immediate demands for expanded infrastructure and community services.
If housing growth doesn’t keep pace across Derbyshire, rising populations may push up house prices and reduce affordability for buying or renting.
An ageing population, with a higher dependency ratio and fewer working-age residents to support the workforce and economy may require a plan to attract younger people and families to settle within the county. Growth in (older people in general (65+), and in particular the 90 years and over age group will likely intensify demand for health and social care over the next decades, adding strain to already stretched services.
Six of eight Derbyshire districts will see fewer children aged 0-19 by 2047, which could lower school enrolments and lead to closures where declines are steepest.
North East Derbyshire and South Derbyshire, however, will see increases in young residents, prompting a need for more school places.
All districts and boroughs will have more deaths than births; inward migration will drive further population growth.
Despite below-average international migration rates, the number of people with English as a second language will rise, requiring services to adapt accordingly.